


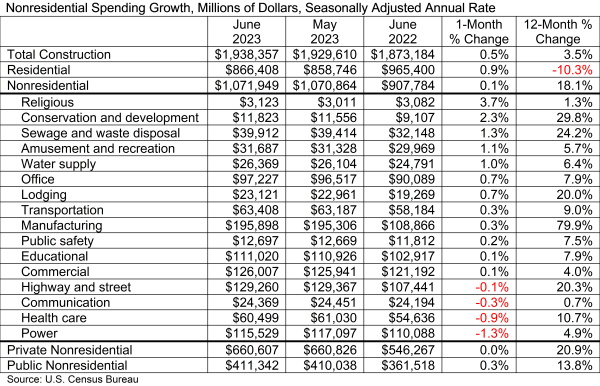
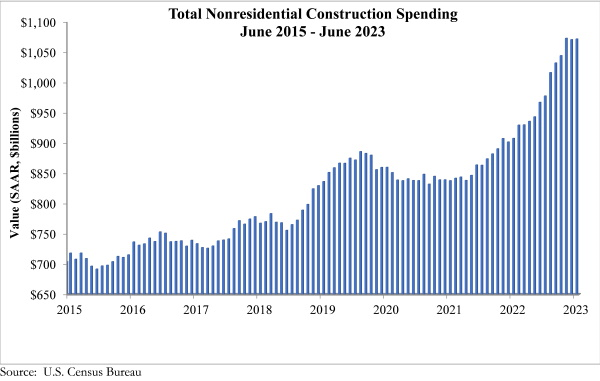
National nonresidential construction spending increased 0.1% in June, according to an Associated Builders and Contractors analysis of data published today by the U.S. Census Bureau. Spending is up 18% over the past 12 months. On a seasonally adjusted annualized basis, nonresidential spending totaled $1.07 trillion in June.
Spending increased on a monthly basis in 12 of the 16 nonresidential subcategories. Private nonresidential spending was virtually unchanged, while public nonresidential construction spending rose 0.3% in June.
“Nonresidential construction spending growth downshifted over the past two months,” said ABC Chief Economist Anirban Basu. “While stakeholders can expect ongoing spending growth in public nonresidential construction segments as more Infrastructure Investment and Jobs Act monies flow into the economy, private developer-driven activity appears to be drying up in the context of higher costs of capital and tighter credit conditions.
“Among other things, these dynamics will translate into larger spreads in performance among contractors,” said Basu. “While those that focus on public work stand to remain busy for years to come, those who specialize in meeting the needs of developers of office buildings, hotels and shopping centers are likely to struggle to support backlog going forward. The good news is that there remain private construction segments associated with rosier prospects, including manufacturing, data centers and healthcare.”
Related Stories

Market Data | Jan 3, 2022
Construction spending in November increases from October and year ago
Construction spending in November totaled $1.63 trillion at a seasonally adjusted annual rate.

Market Data | Dec 22, 2021
Two out of three metro areas add construction jobs from November 2020 to November 2021
Construction employment increased in 237 or 66% of 358 metro areas over the last 12 months.

Market Data | Dec 17, 2021
Construction jobs exceed pre-pandemic level in 18 states and D.C.
Firms struggle to find qualified workers to keep up with demand.

Market Data | Dec 15, 2021
Widespread steep increases in materials costs in November outrun prices for construction projects
Construction officials say efforts to address supply chain challenges have been insufficient.

Market Data | Dec 15, 2021
Demand for design services continues to grow
Changing conditions could be on the horizon.

Market Data | Dec 5, 2021
Construction adds 31,000 jobs in November
Gains were in all segments, but the industry will need even more workers as demand accelerates.

Market Data | Dec 5, 2021
Construction spending rebounds in October
Growth in most public and private nonresidential types is offsetting the decline in residential work.

Market Data | Dec 5, 2021
Nonresidential construction spending increases nearly 1% in October
Spending was up on a monthly basis in 13 of the 16 nonresidential subcategories.

Market Data | Nov 30, 2021
Two-thirds of metro areas add construction jobs from October 2020 to October 2021
The pandemic and supply chain woes may limit gains.

Market Data | Nov 22, 2021
Only 16 states and D.C. added construction jobs since the pandemic began
Texas, Wyoming have worst job losses since February 2020, while Utah, South Dakota add the most.


