


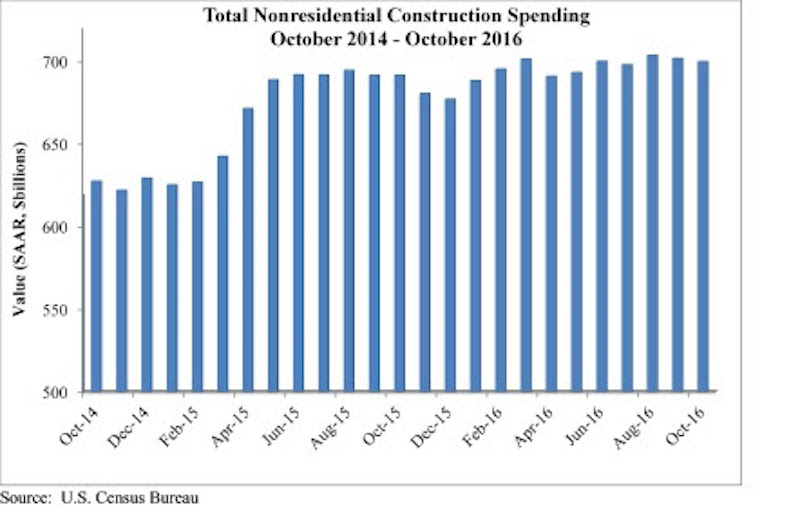
Nonresidential construction spending totaled $699.7 billion on a seasonally adjusted, annualized basis in October, a 0.3 percent decrease from September’s significantly upwardly revised total, but an increase of 2.6 percent year-over-year according to analysis of U.S. Census Bureau data released today by Associated Builders and Contractors (ABC).
September’s nonresidential spending estimate was revised from $690.5 billion to $701.7 billion, a 1.6 percent increase. August’s estimate received a similar revision, increasing from $696.6 billion to $703.6 billion. Nonresidential spending is now 2.6 percent higher than at the same time one year ago.
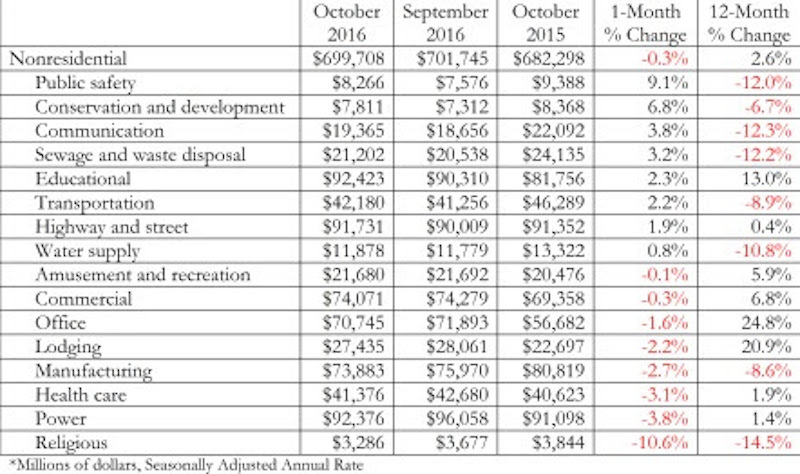
“Nonresidential construction spending is up by nearly 3 percent on a year-over-year basis. Certain segments are red hot, including the office and lodging segments, both of which have experienced more than 20 percent spending growth over the past 12 months,” says ABC Chief Economist Anirban Basu in a press release. “Both major presidential candidates had discussed investing in infrastructure during their campaign. However, there was a conventional wisdom suggesting that divided government would be the most likely outcome, which would likely have translated into more stalemates and less infrastructure spending. With one party now controlling the U.S. Senate, U.S. House of Representatives and the White House, a meaningful infrastructure package may be more likely.”
You can find a chart and a graph illustrating the most recent nonresidential construction spending below.
Related Stories

Market Data | Mar 24, 2017
These are the most and least innovative states for 2017
Connecticut, Virginia, and Maryland are all in the top 10 most innovative states, but none of them were able to claim the number one spot.

Market Data | Mar 22, 2017
After a strong year, construction industry anxious about Washington’s proposed policy shifts
Impacts on labor and materials costs at issue, according to latest JLL report.

Market Data | Mar 22, 2017
Architecture Billings Index rebounds into positive territory
Business conditions projected to solidify moving into the spring and summer.

Market Data | Mar 15, 2017
ABC's Construction Backlog Indicator fell to end 2016
Contractors in each segment surveyed all saw lower backlog during the fourth quarter, with firms in the heavy industrial segment experiencing the largest drop.

Market Data | Feb 28, 2017
Leopardo’s 2017 Construction Economics Report shows year-over-year construction spending increase of 4.2%
The pace of growth was slower than in 2015, however.

Market Data | Feb 23, 2017
Entering 2017, architecture billings slip modestly
Despite minor slowdown in overall billings, commercial/ industrial and institutional sectors post strongest gains in over 12 months.

Market Data | Feb 16, 2017
How does your hospital stack up? Grumman/Butkus Associates 2016 Hospital Benchmarking Survey
Report examines electricity, fossil fuel, water/sewer, and carbon footprint.

Market Data | Feb 1, 2017
Nonresidential spending falters slightly to end 2016
Nonresidential spending decreased from $713.1 billion in November to $708.2 billion in December.

Market Data | Jan 31, 2017
AIA foresees nonres building spending increasing, but at a slower pace than in 2016
Expects another double-digit growth year for office construction, but a more modest uptick for health-related building.
High-rise Construction | Jan 23, 2017
Growth spurt: A record-breaking 128 buildings of 200 meters or taller were completed in 2016
This marks the third consecutive record-breaking year for building completions over 200 meters.


