


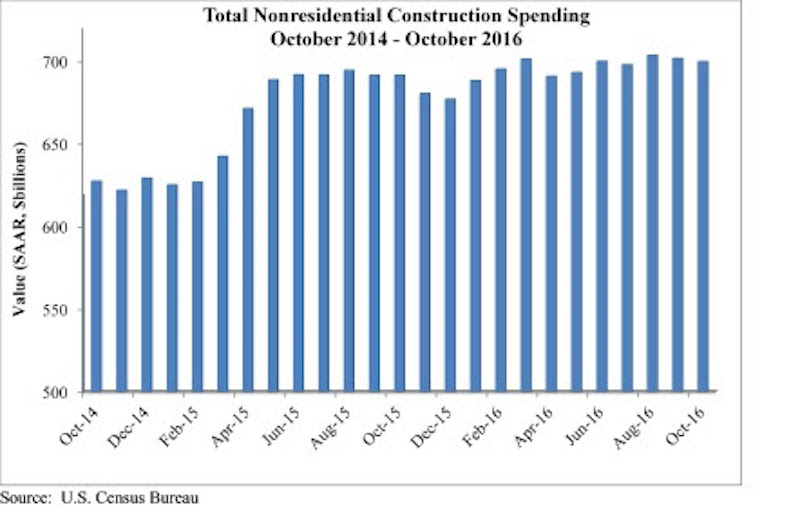
Nonresidential construction spending totaled $699.7 billion on a seasonally adjusted, annualized basis in October, a 0.3 percent decrease from September’s significantly upwardly revised total, but an increase of 2.6 percent year-over-year according to analysis of U.S. Census Bureau data released today by Associated Builders and Contractors (ABC).
September’s nonresidential spending estimate was revised from $690.5 billion to $701.7 billion, a 1.6 percent increase. August’s estimate received a similar revision, increasing from $696.6 billion to $703.6 billion. Nonresidential spending is now 2.6 percent higher than at the same time one year ago.
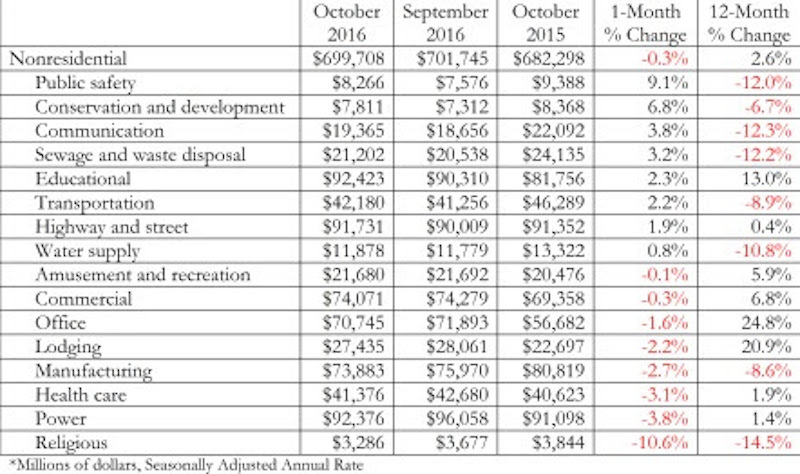
“Nonresidential construction spending is up by nearly 3 percent on a year-over-year basis. Certain segments are red hot, including the office and lodging segments, both of which have experienced more than 20 percent spending growth over the past 12 months,” says ABC Chief Economist Anirban Basu in a press release. “Both major presidential candidates had discussed investing in infrastructure during their campaign. However, there was a conventional wisdom suggesting that divided government would be the most likely outcome, which would likely have translated into more stalemates and less infrastructure spending. With one party now controlling the U.S. Senate, U.S. House of Representatives and the White House, a meaningful infrastructure package may be more likely.”
You can find a chart and a graph illustrating the most recent nonresidential construction spending below.
Related Stories

Healthcare Facilities | Jul 11, 2024
New download: BD+C's 2024 Healthcare Annual Report
Welcome to Building Design+Construction’s 2024 Healthcare Annual Report. This free 66-page special report is our first-ever “state of the state” update on the $65 billion healthcare construction sector.

Contractors | Jul 9, 2024
The average U.S. contractor has 8.4 months worth of construction work in the pipeline, as of June 2024
Associated Builders and Contractors reported today that its Construction Backlog Indicator increased to 8.4 months in June, according to an ABC member survey conducted June 20 to July 3. The reading is down 0.5 months from June 2023.

Office Buildings | Jul 8, 2024
Office vacancy peak of 22% to 28% forecasted for 2026
The work from home trend will continue to put pressure on the office real estate market, with peak vacancy of between 22% and 28% in 2026, according to a forecast by Moody’s.

Healthcare Facilities | Jun 25, 2024
Register today! BD+C live webinar: Key Trends in the Healthcare Facilities Market for 2024-2025
Join the Building Design+Construction editorial team for this live webinar on key trends, innovations, and opportunities in the $65 billion U.S. healthcare buildings market. This free live webinar, hosted by BD+C editors, will take place Thursday, July 11 at Noon ET / 11 AM Central.

Apartments | Jun 25, 2024
10 hardest places to find an apartment in 2024
The challenge of finding an available rental continues to increase for Americans nation-wide. On average, there are eight prospective tenants vying for the same vacant apartment.

Contractors | Jun 12, 2024
The average U.S. contractor has 8.3 months worth of construction work in the pipeline, as of May 2024
Associated Builders and Contractors reported that its Construction Backlog Indicator fell to 8.3 months in May, according to an ABC member survey conducted May 20 to June 4. The reading is down 0.6 months from May 2023.

MFPRO+ News | Jun 11, 2024
Rents rise in multifamily housing for May 2024
Multifamily rents rose for the fourth month in a row, according to the May 2024 National Multifamily Report. Up 0.6% year-over-year, the average U.S. asking rent increased by $6 in May, up to $1,733.

Construction Costs | May 16, 2024
New download: BD+C's May 2024 Market Intelligence Report
Building Design+Construction's monthly Market Intelligence Report offers a snapshot of the health of the U.S. building construction industry, including the commercial, multifamily, institutional, and industrial building sectors. This report tracks the latest metrics related to construction spending, demand for design services, contractor backlogs, and material price trends.

Contractors | May 15, 2024
The average U.S. contractor has 8.4 months worth of construction work in the pipeline, as of April 2024
Associated Builders and Contractors reported that its Construction Backlog Indicator increased to 8.4 months in April, according to an ABC member survey conducted April 22 to May 6. The reading is down 0.5 months from April 2023, but expanded 0.2 months from the prior month.

Healthcare Facilities | May 6, 2024
Hospital construction costs for 2024
Data from Gordian breaks down the average cost per square foot for a three-story hospital across 10 U.S. cities.


