


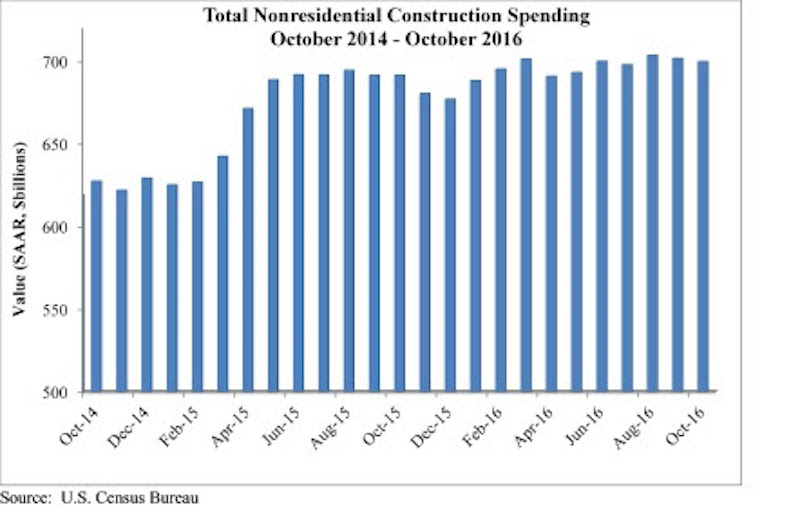
Nonresidential construction spending totaled $699.7 billion on a seasonally adjusted, annualized basis in October, a 0.3 percent decrease from September’s significantly upwardly revised total, but an increase of 2.6 percent year-over-year according to analysis of U.S. Census Bureau data released today by Associated Builders and Contractors (ABC).
September’s nonresidential spending estimate was revised from $690.5 billion to $701.7 billion, a 1.6 percent increase. August’s estimate received a similar revision, increasing from $696.6 billion to $703.6 billion. Nonresidential spending is now 2.6 percent higher than at the same time one year ago.
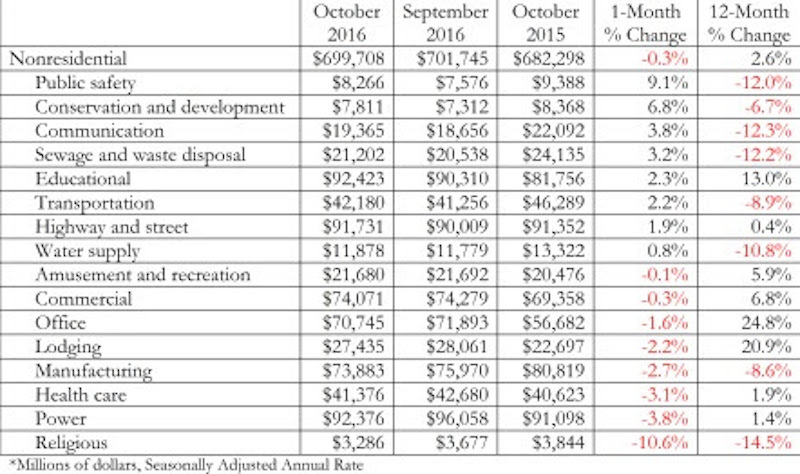
“Nonresidential construction spending is up by nearly 3 percent on a year-over-year basis. Certain segments are red hot, including the office and lodging segments, both of which have experienced more than 20 percent spending growth over the past 12 months,” says ABC Chief Economist Anirban Basu in a press release. “Both major presidential candidates had discussed investing in infrastructure during their campaign. However, there was a conventional wisdom suggesting that divided government would be the most likely outcome, which would likely have translated into more stalemates and less infrastructure spending. With one party now controlling the U.S. Senate, U.S. House of Representatives and the White House, a meaningful infrastructure package may be more likely.”
You can find a chart and a graph illustrating the most recent nonresidential construction spending below.
Related Stories

Market Data | May 25, 2018
Construction group uses mobile technology to make highway work zones safer
Mobile advertising campaign urges drivers who routinely pass through certain work zones to slow down and be alert as new data shows motorists are more likely to be injured than construction workers.

Market Data | May 23, 2018
Architecture firm billings strengthen in April
Firms report solid growth for seven straight months.

Market Data | May 22, 2018
Vacancies stable, rents rising, and pipeline receding, according to Transwestern’s 1Q US Office Market report
The Big Apple still leads the new construction charge.

Market Data | May 18, 2018
Construction employment rises in 38 states and D.C. from April 2017 to April 2018
California & West Virginia have biggest annual job gains, North Dakota has largest decline; California & Louisiana have largest monthly pickup, Indiana & North Dakota lead monthly drops.

High-rise Construction | May 18, 2018
The 100 tallest buildings ever conventionally demolished
The list comes from a recent CTBUH study.

Resiliency | May 17, 2018
Architects brief lawmakers and policy-makers on disaster recovery as hurricane season approaches
Urge senate passage of disaster recovery reform act; Relationship-building with local communities.

Market Data | May 17, 2018
These 25 cities have the highest urban infill development potential
The results stem from a COMMERCIALCafé study.

Market Data | May 10, 2018
Construction costs surge in April as new tariffs and other trade measures lead to significant increases in materials prices
Association officials warn that the new tariffs and resulting price spikes have the potential to undermine benefits of tax and regulatory reform, urge administration to reconsider.

Market Data | May 7, 2018
Construction employers add 17,000 jobs in April and 257,000 for the year
Unemployment rate for construction increases slightly compared to year earlier as higher pay levels appears to be attracting people with recent construction experience back into the workforce.

Market Data | May 2, 2018
Construction employment increases in 245 metro areas between March 2017 & 2018, as trade fights & infrastructure funding shortfalls loom
Houston-The Woodlands-Sugar Land, Texas and Weirton-Steubenville, W.Va.-Ohio experience largest year-over-year gains; Baton Rouge, La. and Auburn-Opelika, Ala. have biggest annual declines.


