


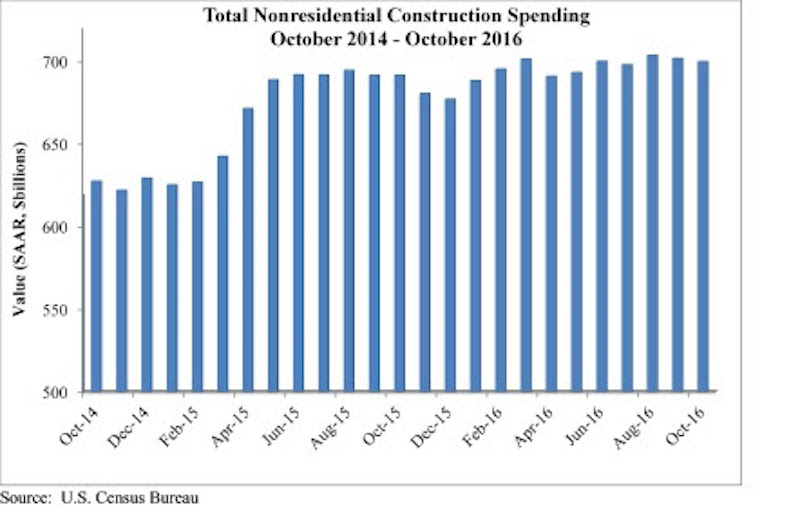
Nonresidential construction spending totaled $699.7 billion on a seasonally adjusted, annualized basis in October, a 0.3 percent decrease from September’s significantly upwardly revised total, but an increase of 2.6 percent year-over-year according to analysis of U.S. Census Bureau data released today by Associated Builders and Contractors (ABC).
September’s nonresidential spending estimate was revised from $690.5 billion to $701.7 billion, a 1.6 percent increase. August’s estimate received a similar revision, increasing from $696.6 billion to $703.6 billion. Nonresidential spending is now 2.6 percent higher than at the same time one year ago.
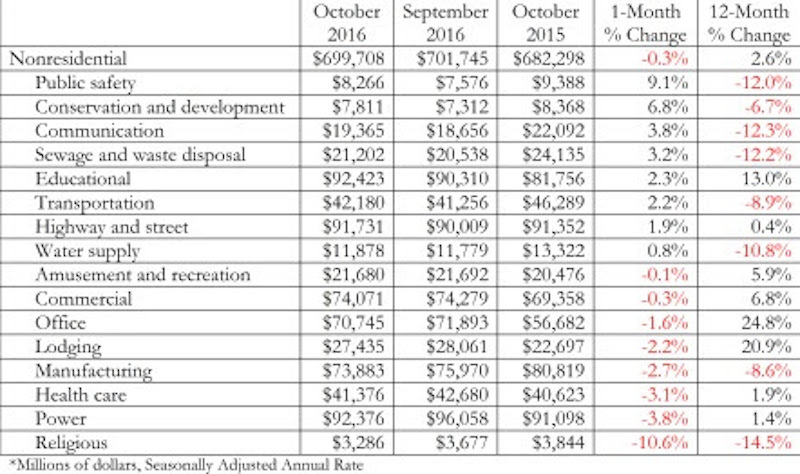
“Nonresidential construction spending is up by nearly 3 percent on a year-over-year basis. Certain segments are red hot, including the office and lodging segments, both of which have experienced more than 20 percent spending growth over the past 12 months,” says ABC Chief Economist Anirban Basu in a press release. “Both major presidential candidates had discussed investing in infrastructure during their campaign. However, there was a conventional wisdom suggesting that divided government would be the most likely outcome, which would likely have translated into more stalemates and less infrastructure spending. With one party now controlling the U.S. Senate, U.S. House of Representatives and the White House, a meaningful infrastructure package may be more likely.”
You can find a chart and a graph illustrating the most recent nonresidential construction spending below.
Related Stories

Market Data | Jul 31, 2019
For the second quarter of 2019, the U.S. hotel construction pipeline continued its year-over-year growth spurt
The growth spurt continued even as business investment declined for the first time since 2016.

Market Data | Jul 23, 2019
Despite signals of impending declines, continued growth in nonresidential construction is expected through 2020
AIA’s latest Consensus Construction Forecast predicts growth.

Market Data | Jul 20, 2019
Construction costs continued to rise in second quarter
Labor availability is a big factor in that inflation, according to Rider Levett Bucknall report.

Market Data | Jul 18, 2019
Construction contractors remain confident as summer begins
Contractors were slightly less upbeat regarding profit margins and staffing levels compared to April.

Market Data | Jul 17, 2019
Design services demand stalled in June
Project inquiry gains hit a 10-year low.

Market Data | Jul 16, 2019
ABC’s Construction Backlog Indicator increases modestly in May
The Construction Backlog Indicator expanded to 8.9 months in May 2019.

K-12 Schools | Jul 15, 2019
Summer assignments: 2019 K-12 school construction costs
Using RSMeans data from Gordian, here are the most recent costs per square foot for K-12 school buildings in 10 cities across the U.S.

Market Data | Jul 12, 2019
Construction input prices plummet in June
This is the first time in nearly three years that input prices have fallen on a year-over-year basis.

Market Data | Jul 1, 2019
Nonresidential construction spending slips modestly in May
Among the 16 nonresidential construction spending categories tracked by the Census Bureau, five experienced increases in monthly spending.

Market Data | Jul 1, 2019
Almost 60% of the U.S. construction project pipeline value is concentrated in 10 major states
With a total of 1,302 projects worth $524.6 billion, California has both the largest number and value of projects in the U.S. construction project pipeline.


