


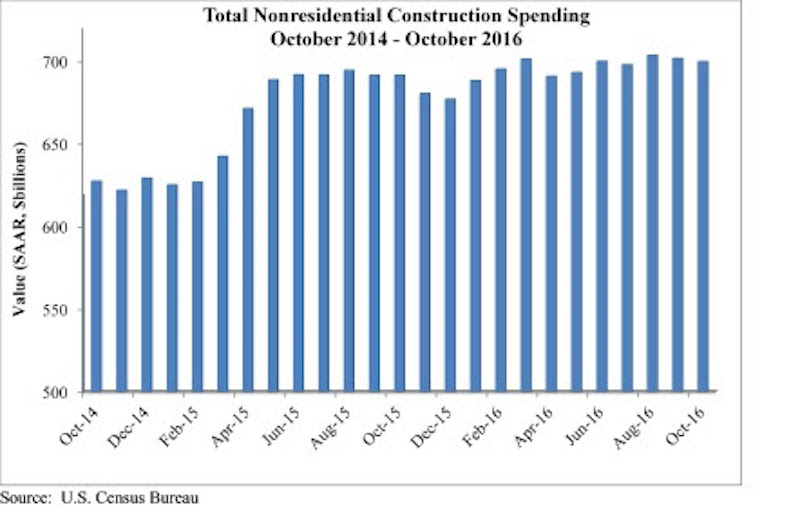
Nonresidential construction spending totaled $699.7 billion on a seasonally adjusted, annualized basis in October, a 0.3 percent decrease from September’s significantly upwardly revised total, but an increase of 2.6 percent year-over-year according to analysis of U.S. Census Bureau data released today by Associated Builders and Contractors (ABC).
September’s nonresidential spending estimate was revised from $690.5 billion to $701.7 billion, a 1.6 percent increase. August’s estimate received a similar revision, increasing from $696.6 billion to $703.6 billion. Nonresidential spending is now 2.6 percent higher than at the same time one year ago.
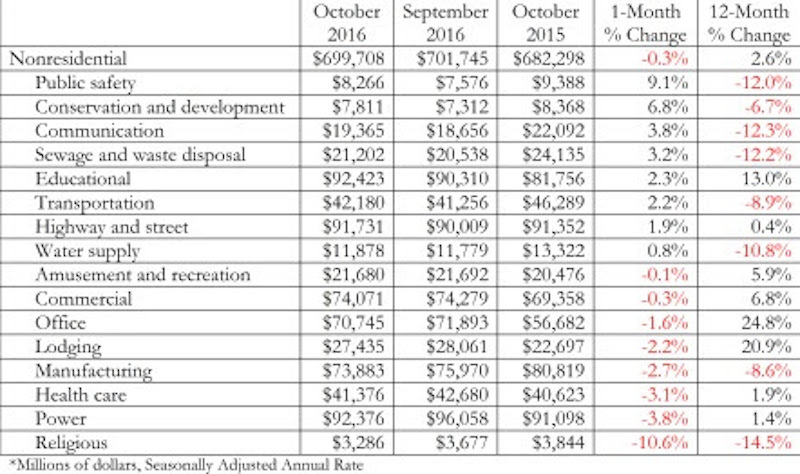
“Nonresidential construction spending is up by nearly 3 percent on a year-over-year basis. Certain segments are red hot, including the office and lodging segments, both of which have experienced more than 20 percent spending growth over the past 12 months,” says ABC Chief Economist Anirban Basu in a press release. “Both major presidential candidates had discussed investing in infrastructure during their campaign. However, there was a conventional wisdom suggesting that divided government would be the most likely outcome, which would likely have translated into more stalemates and less infrastructure spending. With one party now controlling the U.S. Senate, U.S. House of Representatives and the White House, a meaningful infrastructure package may be more likely.”
You can find a chart and a graph illustrating the most recent nonresidential construction spending below.
Related Stories

Market Data | May 13, 2021
Proliferating materials price increases and supply chain disruptions squeeze contractors and threaten to undermine economic recovery
Producer price index data for April shows wide variety of materials with double-digit price increases.

Market Data | May 7, 2021
Construction employment stalls in April
Soaring costs, supply-chain challenges, and workforce shortages undermine industry's recovery.

Market Data | May 4, 2021
Nonresidential construction outlays drop in March for fourth-straight month
Weak demand, supply-chain woes make further declines likely.

Market Data | May 3, 2021
Nonresidential construction spending decreases 1.1% in March
Spending was down on a monthly basis in 11 of the 16 nonresidential subcategories.

Market Data | Apr 30, 2021
New York City market continues to lead the U.S. Construction Pipeline
New York City has the greatest number of projects under construction with 110 projects/19,457 rooms.

Market Data | Apr 29, 2021
U.S. Hotel Construction pipeline beings 2021 with 4,967 projects/622,218 rooms at Q1 close
Although hotel development may still be tepid in Q1, continued government support and the extension of programs has aided many businesses to get back on their feet as more and more are working to re-staff and re-open.

Market Data | Apr 28, 2021
Construction employment declines in 203 metro areas from March 2020 to March 2021
The decline occurs despite homebuilding boom and improving economy.

Market Data | Apr 20, 2021
The pandemic moves subs and vendors closer to technology
Consigli’s latest market outlook identifies building products that are high risk for future price increases.

Market Data | Apr 20, 2021
Demand for design services continues to rapidly escalate
AIA’s ABI score for March rose to 55.6 compared to 53.3 in February.

Market Data | Apr 16, 2021
Construction employment in March trails March 2020 mark in 35 states
Nonresidential projects lag despite hot homebuilding market.


