


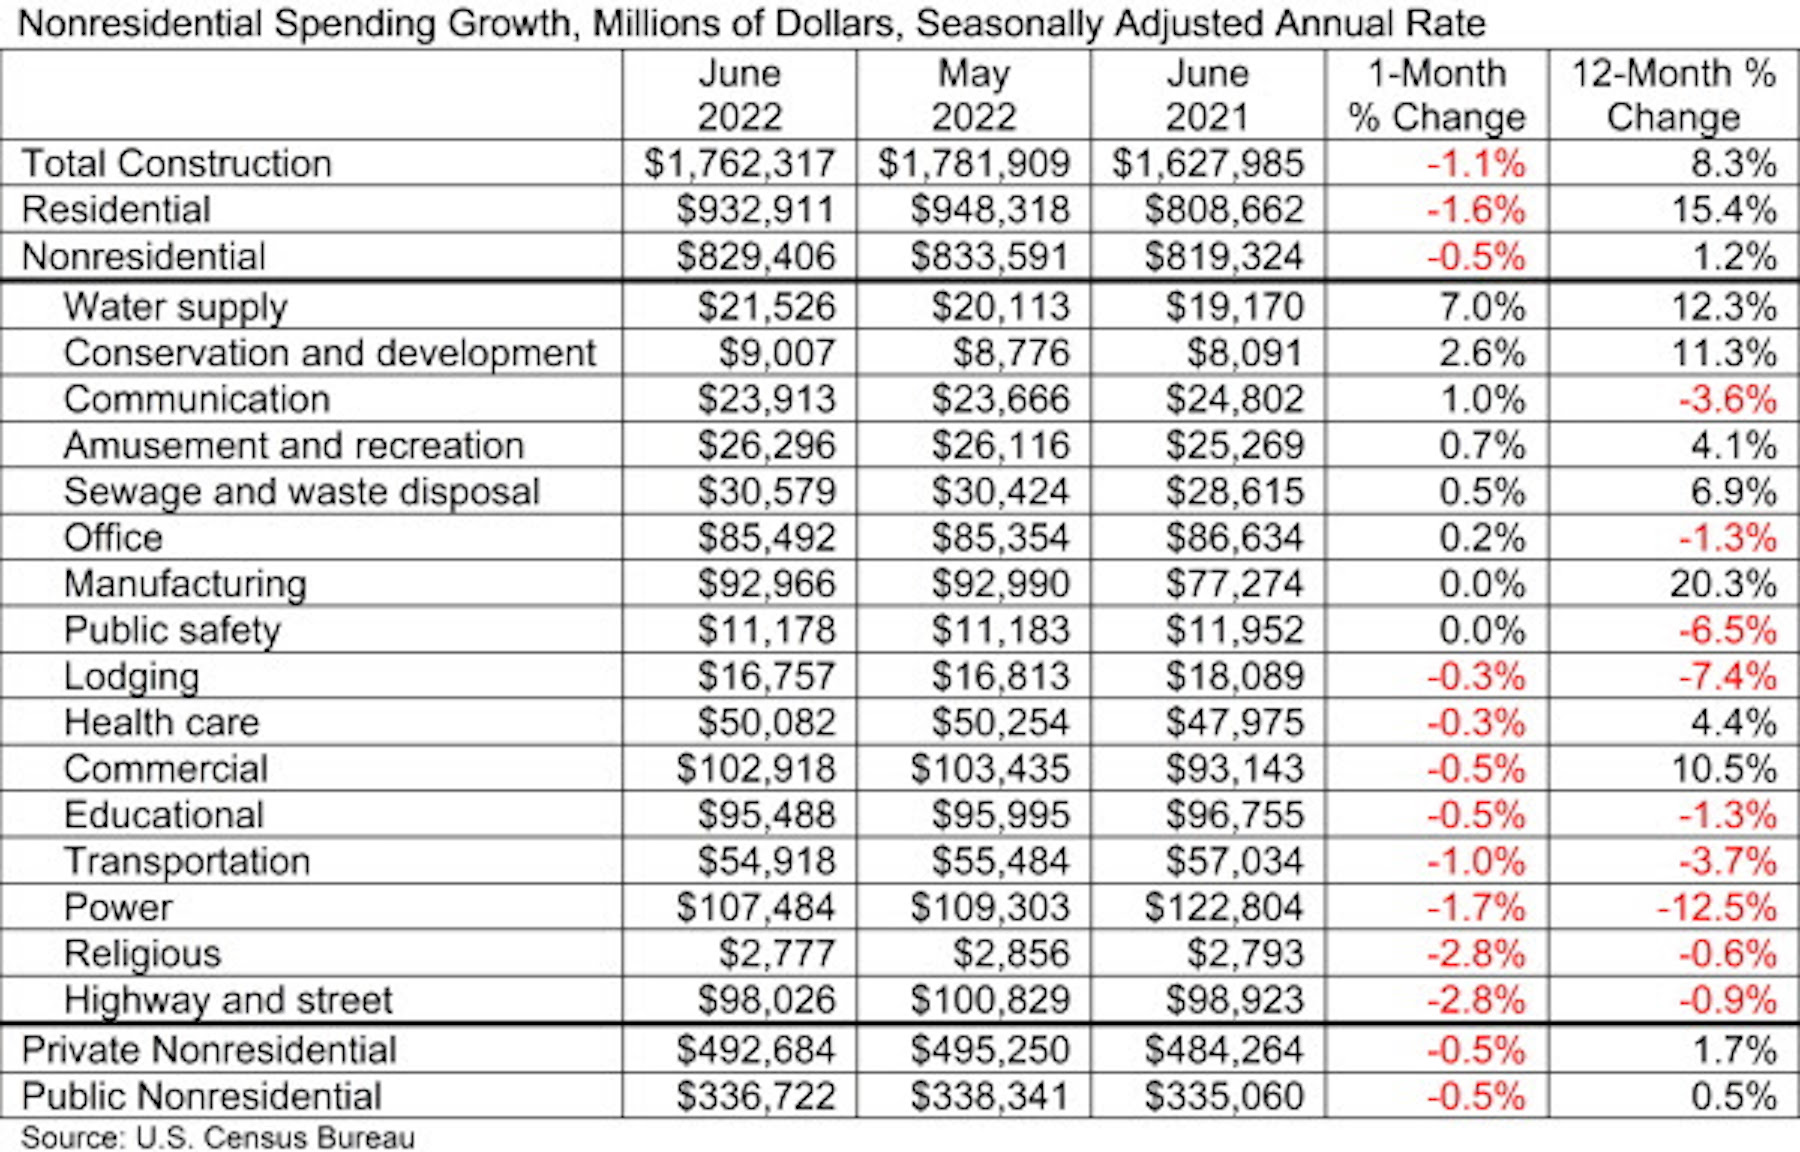
National nonresidential construction spending was down by 0.5% in June, according to an Associated Builders and Contractors analysis of data published today by the U.S. Census Bureau. On a seasonally adjusted annualized basis, nonresidential spending totaled $829.4 billion for the month.
Spending was down on a monthly basis in eight of the 16 nonresidential subcategories. Both private and public nonresidential spending fell by 0.5% in June.
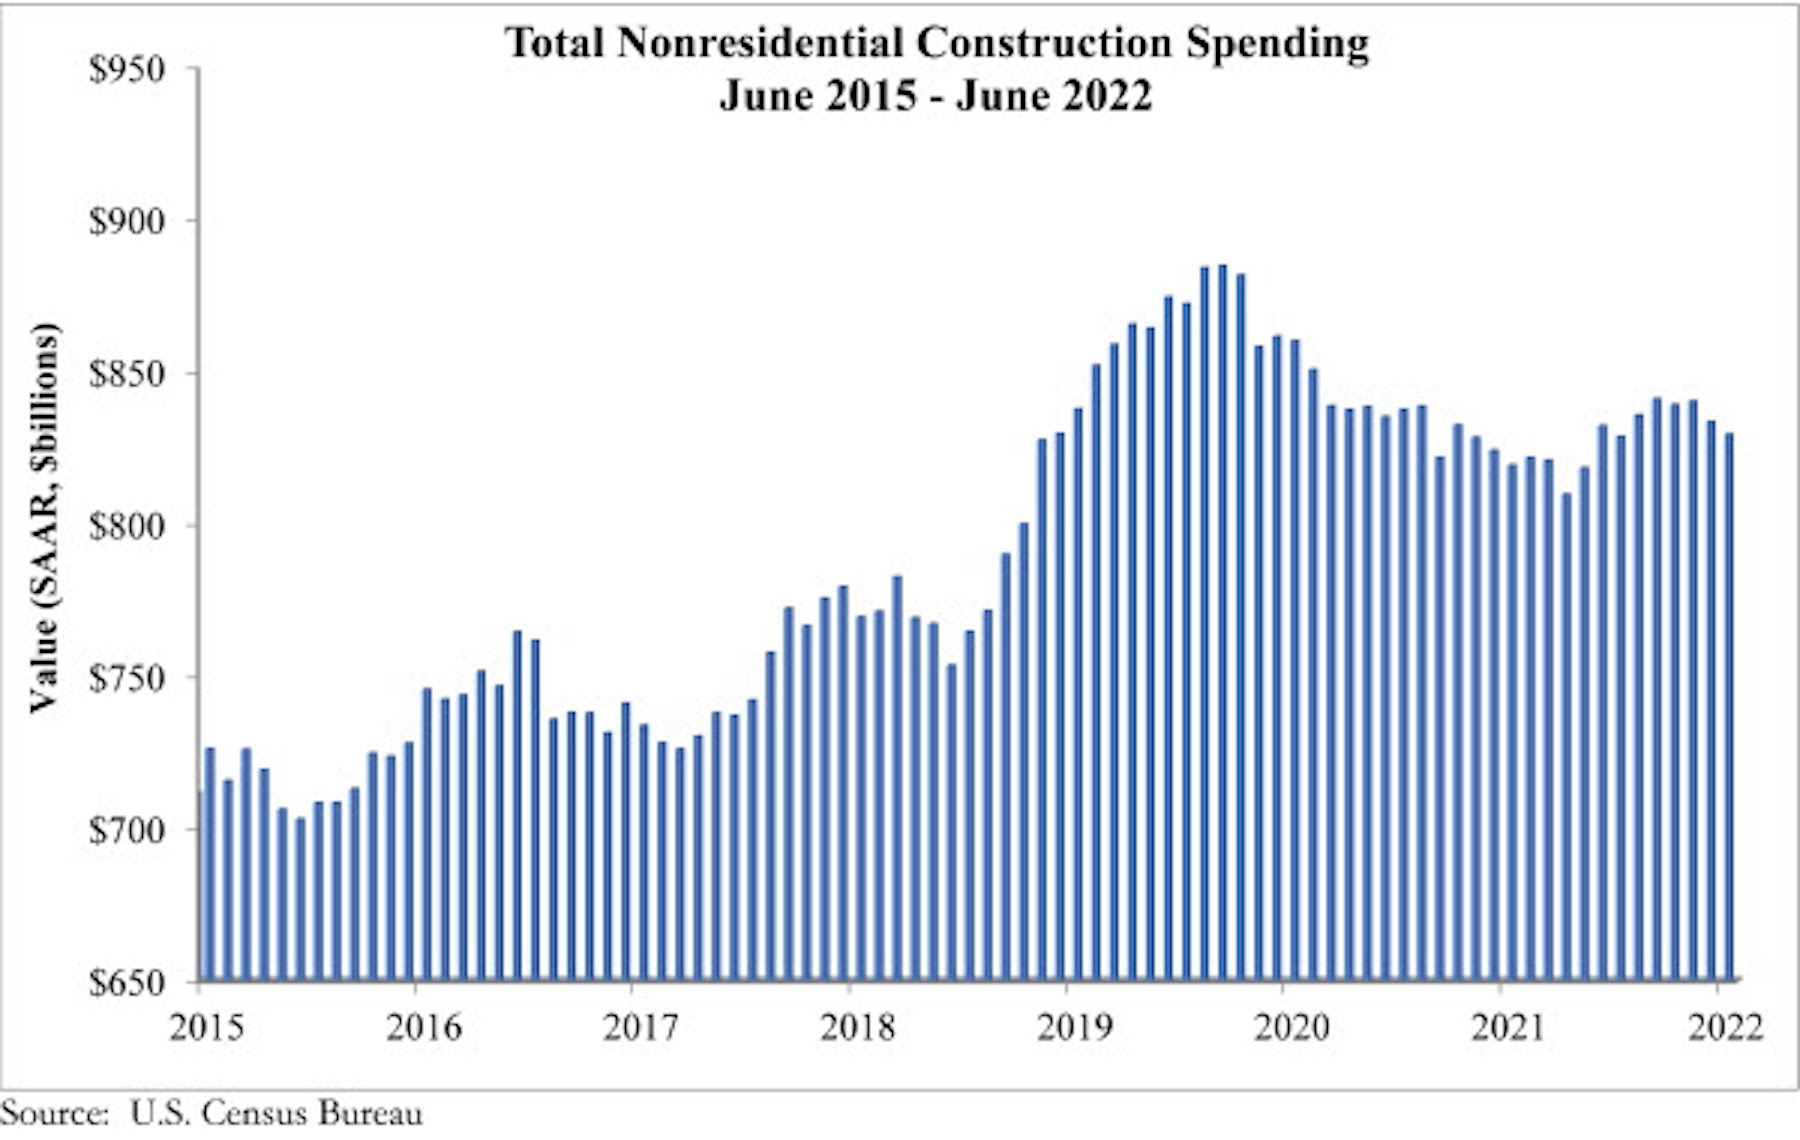
“There continues to be significant downward pressure on nonresidential construction spending volumes, and that is likely to intensify going forward,” said ABC Chief Economist Anirban Basu. “To date, construction spending measured in dollars has been propped up by elevated construction delivery costs, including higher materials prices and rapidly rising wages. Despite those inflationary pressures, aggregate nonresidential construction spending has failed to recover to pre-pandemic levels in nominal terms. The situation looks even worse when adjusting for inflation.
“The primary issue is that those high construction delivery charges are inducing a significant fraction of project owners to reconsider start dates,” said Basu. “True, backlog remains elevated, according to ABC’s Construction Backlog Indicator, but this may be because it is taking longer to complete projects. Additional project delays and cancellations are likely as borrowing costs continue to ratchet higher for those who purchase construction services and as the risk of recession increases. For now, many contractors remain busy and continue to operate at or near capacity. Whether that will continue for another 12 to 18 months remains an unanswered question.”
Related Stories

Market Data | Dec 19, 2018
Run of positive billings continues at architecture firms
November marked the fourteenth consecutive month of increasing demand for architectural firm services.

Market Data | Dec 5, 2018
ABC predicts construction sector will remain strong in 2019
Job growth, high backlog and healthy infrastructure investment all spell good news for the industry.

Market Data | Dec 4, 2018
Nonresidential spending rises modestly in October
Thirteen out of 16 subsectors are associated with year-over-year increases.

Market Data | Nov 20, 2018
Construction employment rises from October 2017 to October 2018 in 44 states and D.C.
Texas has biggest annual job increase while New Jersey continues losses; Iowa, Florida and California have largest one-month gains as Mississippi and Louisiana trail.

Market Data | Nov 15, 2018
Architecture firm billings continue to slow, but remain positive in October
Southern region reports decline in billings for the first time since June 2012.

Market Data | Nov 14, 2018
A new Joint Center report finds aging Americans less prepared to afford housing
The study foresees a significant segment of seniors struggling to buy or rent on their own or with other people.

Market Data | Nov 12, 2018
Leading hotel markets in the U.S. construction pipeline
Projects already under construction and those scheduled to start construction in the next 12 months, combined, have a total of 3,782 projects/213,798 rooms and are at cyclical highs.

Market Data | Nov 6, 2018
Unflagging national office market enjoys economic tailwinds
Stable vacancy helped push asking rents 4% higher in third quarter.

Market Data | Nov 2, 2018
Nonresidential spending retains momentum in September, up 8.9% year over year
Total nonresidential spending stood at $767.1 billion on a seasonally adjusted, annualized rate in September.

Market Data | Oct 30, 2018
Construction projects planned and ongoing by world’s megacities valued at $4.2trn
The report states that Dubai tops the list with total project values amounting to US$374.2bn.


