


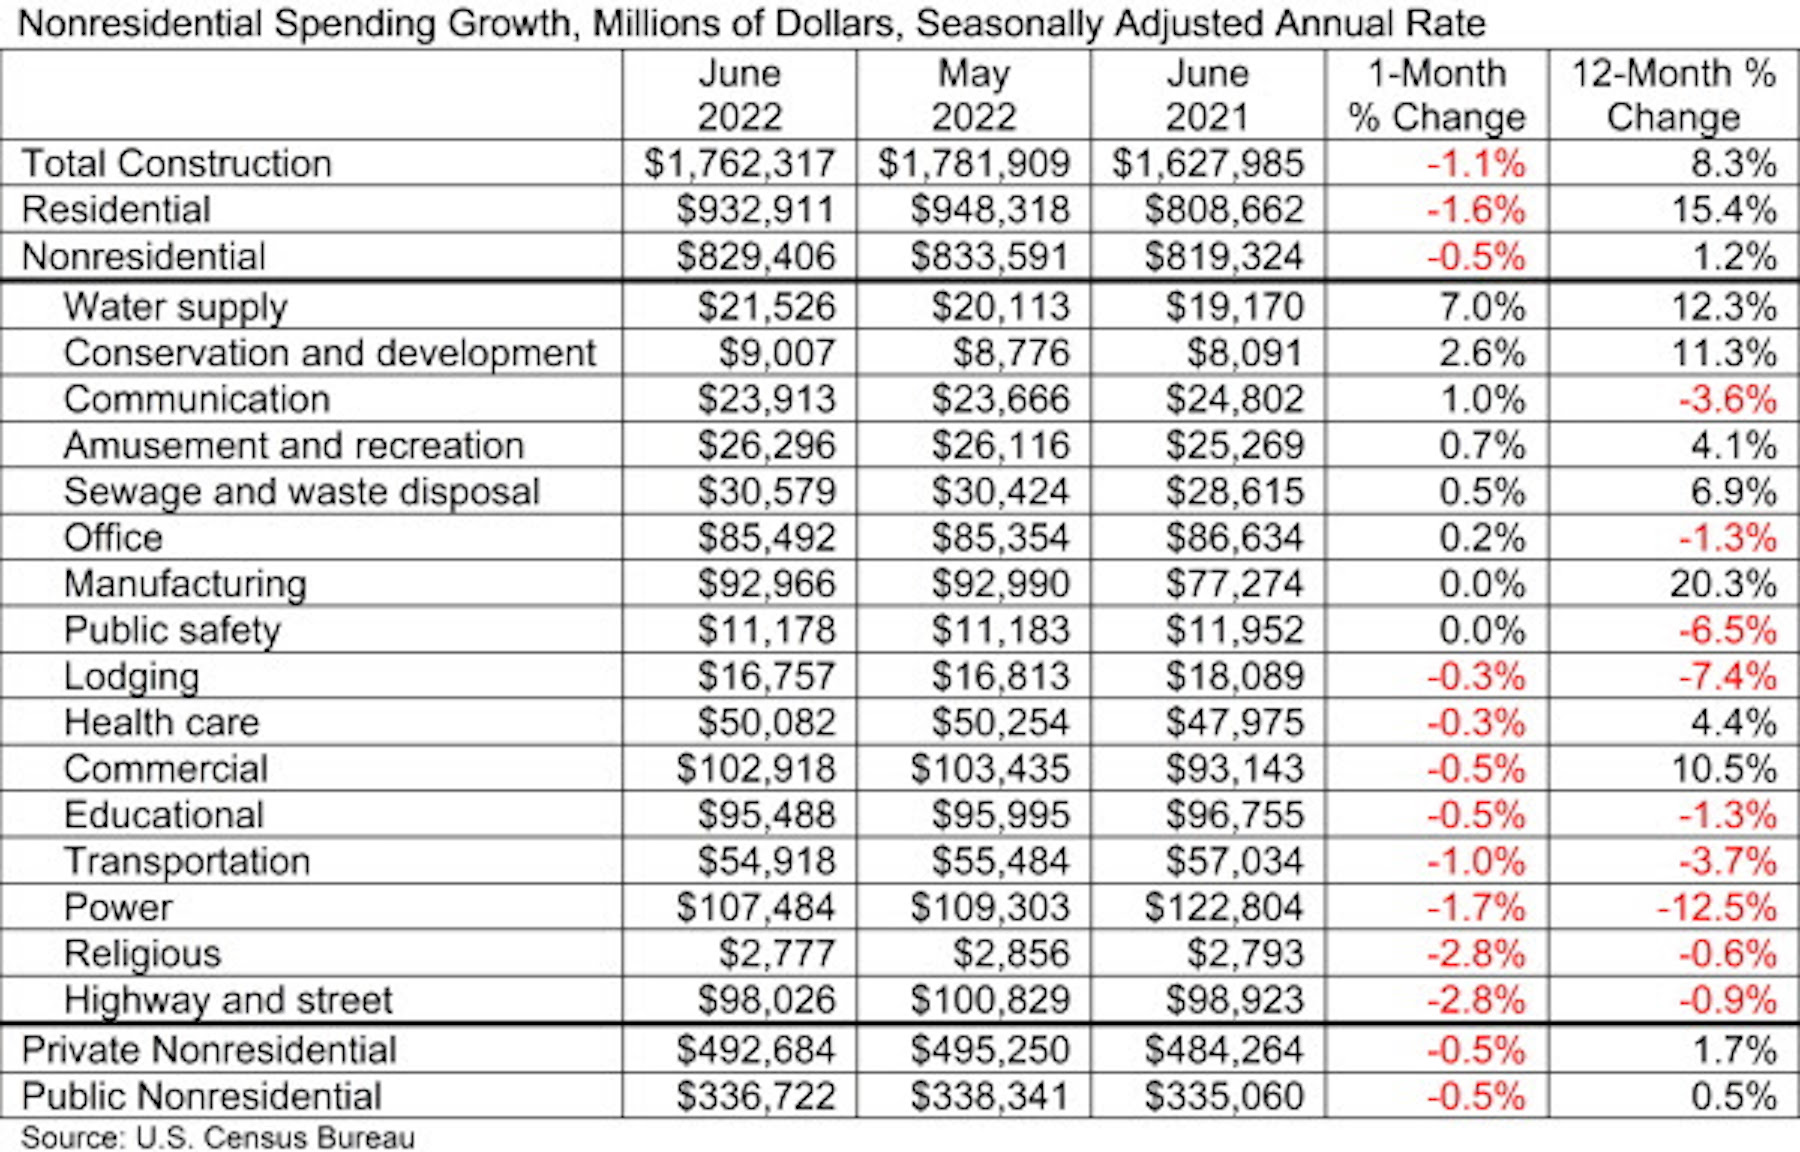
National nonresidential construction spending was down by 0.5% in June, according to an Associated Builders and Contractors analysis of data published today by the U.S. Census Bureau. On a seasonally adjusted annualized basis, nonresidential spending totaled $829.4 billion for the month.
Spending was down on a monthly basis in eight of the 16 nonresidential subcategories. Both private and public nonresidential spending fell by 0.5% in June.
“There continues to be significant downward pressure on nonresidential construction spending volumes, and that is likely to intensify going forward,” said ABC Chief Economist Anirban Basu. “To date, construction spending measured in dollars has been propped up by elevated construction delivery costs, including higher materials prices and rapidly rising wages. Despite those inflationary pressures, aggregate nonresidential construction spending has failed to recover to pre-pandemic levels in nominal terms. The situation looks even worse when adjusting for inflation.
“The primary issue is that those high construction delivery charges are inducing a significant fraction of project owners to reconsider start dates,” said Basu. “True, backlog remains elevated, according to ABC’s Construction Backlog Indicator, but this may be because it is taking longer to complete projects. Additional project delays and cancellations are likely as borrowing costs continue to ratchet higher for those who purchase construction services and as the risk of recession increases. For now, many contractors remain busy and continue to operate at or near capacity. Whether that will continue for another 12 to 18 months remains an unanswered question.”
Related Stories

K-12 Schools | Jul 15, 2019
Summer assignments: 2019 K-12 school construction costs
Using RSMeans data from Gordian, here are the most recent costs per square foot for K-12 school buildings in 10 cities across the U.S.

Market Data | Jul 12, 2019
Construction input prices plummet in June
This is the first time in nearly three years that input prices have fallen on a year-over-year basis.

Market Data | Jul 1, 2019
Nonresidential construction spending slips modestly in May
Among the 16 nonresidential construction spending categories tracked by the Census Bureau, five experienced increases in monthly spending.

Market Data | Jul 1, 2019
Almost 60% of the U.S. construction project pipeline value is concentrated in 10 major states
With a total of 1,302 projects worth $524.6 billion, California has both the largest number and value of projects in the U.S. construction project pipeline.

Market Data | Jun 21, 2019
Architecture billings remain flat
AIA’s Architecture Billings Index (ABI) score for May showed a small increase in design services at 50.2.

Market Data | Jun 19, 2019
Number of U.S. architects continues to rise
New data from NCARB reveals that the number of architects continues to increase.

Market Data | Jun 12, 2019
Construction input prices see slight increase in May
Among the 11 subcategories, six saw prices fall last month, with the largest decreases in natural gas.

Market Data | Jun 3, 2019
Nonresidential construction spending up 6.4% year over year in April
Among the 16 sectors tracked by the U.S. Census Bureau, nine experienced an increase in monthly spending, led by water supply and highway and street.

Market Data | Jun 3, 2019
4.1% annual growth in office asking rents above five-year compound annual growth rate
Market has experienced no change in office vacancy rates in three quarters.

Market Data | May 30, 2019
Construction employment increases in 250 out of 358 metros from April 2018 to April 2019
Demand for work is outpacing the supply of workers.


