


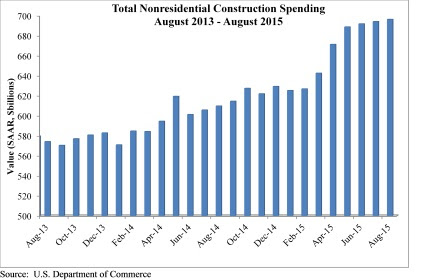
August marked the seventh consecutive month nonresidential construction spending expanded according to an Oct. 1 release supplied by the U.S. Census Bureau. Nonresidential spending totaled $696.3 billion on a seasonally adjusted, annualized basis in August, a 0.3% increase from the previous month and a 12.3% increase from the same time last year. The Census Bureau downwardly revised July's estimate from $696.1 billion to $694.1 billion.
"Job growth is fueling both consumer spending and the absorption of space, all of this is good for construction spending," said Associated Builders and Contractors Chief Economist Anirban Basu. "While construction spending has expanded by more than 12% over the past year, that is not to suggest that macroeconomic risks do not abound. Interest rates are likely to head higher going forward and there is no guarantee that energy prices will remain subdued. While low energy prices have caused some regional economies to slow, investment and spending has been bolstered in others.
"Recently, much attention has been focused on the global economic slowdown and the volatility of financial markets," said Basu. "The Federal Reserve's recent decision not to increase interest rates supported a developing narrative which suggests that the weakness now apparent in much of the world will eventually bring the U.S. into another recession."
Eight of 16 nonresidential construction sectors experienced spending increases in August on a monthly basis:
- Lodging-related construction spending expanded 2.8% on a monthly basis and 41.4% on a year–over-year basis
- Health care-related construction spending grew 1.9% on a monthly basis and 9.1% on a yearly basis
- Public safety-related construction spending expanded 0.4% in August and is 0.2% higher than last year
- Spending in the amusement and recreation category grew 1.3% for the month and 34.7% from the same time last year
- Transportation-related construction spending grew 1.4% in August and is up 12.1% from the same time last year
- Communication-related construction spending is up 0.4% for the month and 11.5% on a yearly basis
- Power-related construction spending expanded 1.2% month-over month but is down 6.7% year-over-year
- Manufacturing-related construction spending expanded 1.3% on a monthly basis and 57.6% on a yearly basis
Spending in half of the nonresidential construction subsectors fell in August on a monthly basis:
- Highway and street-related construction spending fell by 0.6% in August but is up 7% from the same time last year
- Sewage and waste disposal-related construction spending is 0.3% lower from July 2015 but 9% higher than in August 2014
- Water supply-related construction spending is down 0.2% for the month but is up 4.9% over the past 12 months
- Conservation and development-related construction spending fell 0.9% for the month but is up 12.7% from the same time last year
- Office-related construction spending dipped 0.2% lower in August but is up 25.4% since the same time last year
- Spending in the commercial category fell 1.2% for the month but grew 1.3% over the past 12 months
- Educational-related construction spending inched 0.6% lower for the month but is up 5.0% year-over-year
- Religious-related construction spending fell 9.4% for the month and 4.6% from August 2014
To view the previous spending report, click here.
Related Stories

Giants 400 | Aug 28, 2019
Top 45 Data Center Construction Firms for 2019
Whiting-Turner, Turner, Holder, DPR, and Fortis top the rankings of the nation's largest data center sector contractors and construction management firms, as reported in Building Design+Construction's 2019 Giants 300 Report.

AEC Innovators | Aug 27, 2019
7 AEC industry disruptors and their groundbreaking achievements
From building prefab factories in the sky to incubating the next generation of AEC tech startups, our 2019 class of AEC Innovators demonstrates that the industry is poised for a shakeup. Meet BD+C’s 2019 AEC Innovators.

Giants 400 | Aug 16, 2019
2019 Healthcare Giants Report: The ‘smart hospital’ is on the horizon
These buildings perform functions like a medical practitioner. This and more healthcare sector trends from Building Design+Construction's 2019 Giants 300 Report.

AEC Innovators | Aug 15, 2019
Oracle’s replica of a construction jobsite creates an immersive environment for AEC professionals
The Oracle Construction and Engineering Innovation Lab allows visitors to walk through five different stages of construction work, to test new AEC technologies and training techniques.

Giants 400 | Aug 13, 2019
2019 Science + Technology Giants Report: Operational flexibility is a must for S+T buildings
The science and technology (S+T) sector is arguably the industry’s most complex because it caters to a diverse clientele with specific priorities and imperatives, according to Building Design+Construction's 2019 Giants 300 Report.

Giants 400 | Aug 8, 2019
Top 110 Office Sector Construction Firms for 2019
Turner, STO Building Group, AECOM, Clayco, and Clark lead the rankings of the nation's largest office sector contractors and construction managers, as reported in Building Design+Construction's 2019 Giants 300 Report.

Giants 400 | Aug 8, 2019
2019 Office Giants Report: Demand for exceptional workplaces will keep the office construction market strong
Office space consolidation and workplace upgrades will keep project teams busy, according to BD+C's 2019 Giants 300 Report.

Museums | Jul 29, 2019
A new museum debuts inside the Empire State Building
A $165 million, 10,000-sf museum opened on the second floor of the Empire State Building in New York City, completing the second of a four-phase “reimagining” of that building’s observatory experience, which draws four million visitors annually.

Multifamily Housing | Jul 23, 2019
Is prefab in your future?
The most important benefit of offsite construction, when done right, is reliability.

Healthcare Facilities | Jul 15, 2019
Can a kids’ healthcare space teach, entertain, and heal?
Standard building requirements don’t have to be boring. Here’s how you can inject whimsical touches into everyday design features.


