


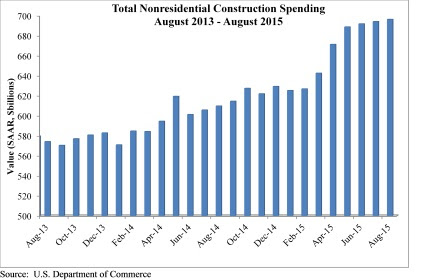
August marked the seventh consecutive month nonresidential construction spending expanded according to an Oct. 1 release supplied by the U.S. Census Bureau. Nonresidential spending totaled $696.3 billion on a seasonally adjusted, annualized basis in August, a 0.3% increase from the previous month and a 12.3% increase from the same time last year. The Census Bureau downwardly revised July's estimate from $696.1 billion to $694.1 billion.
"Job growth is fueling both consumer spending and the absorption of space, all of this is good for construction spending," said Associated Builders and Contractors Chief Economist Anirban Basu. "While construction spending has expanded by more than 12% over the past year, that is not to suggest that macroeconomic risks do not abound. Interest rates are likely to head higher going forward and there is no guarantee that energy prices will remain subdued. While low energy prices have caused some regional economies to slow, investment and spending has been bolstered in others.
"Recently, much attention has been focused on the global economic slowdown and the volatility of financial markets," said Basu. "The Federal Reserve's recent decision not to increase interest rates supported a developing narrative which suggests that the weakness now apparent in much of the world will eventually bring the U.S. into another recession."
Eight of 16 nonresidential construction sectors experienced spending increases in August on a monthly basis:
- Lodging-related construction spending expanded 2.8% on a monthly basis and 41.4% on a year–over-year basis
- Health care-related construction spending grew 1.9% on a monthly basis and 9.1% on a yearly basis
- Public safety-related construction spending expanded 0.4% in August and is 0.2% higher than last year
- Spending in the amusement and recreation category grew 1.3% for the month and 34.7% from the same time last year
- Transportation-related construction spending grew 1.4% in August and is up 12.1% from the same time last year
- Communication-related construction spending is up 0.4% for the month and 11.5% on a yearly basis
- Power-related construction spending expanded 1.2% month-over month but is down 6.7% year-over-year
- Manufacturing-related construction spending expanded 1.3% on a monthly basis and 57.6% on a yearly basis
Spending in half of the nonresidential construction subsectors fell in August on a monthly basis:
- Highway and street-related construction spending fell by 0.6% in August but is up 7% from the same time last year
- Sewage and waste disposal-related construction spending is 0.3% lower from July 2015 but 9% higher than in August 2014
- Water supply-related construction spending is down 0.2% for the month but is up 4.9% over the past 12 months
- Conservation and development-related construction spending fell 0.9% for the month but is up 12.7% from the same time last year
- Office-related construction spending dipped 0.2% lower in August but is up 25.4% since the same time last year
- Spending in the commercial category fell 1.2% for the month but grew 1.3% over the past 12 months
- Educational-related construction spending inched 0.6% lower for the month but is up 5.0% year-over-year
- Religious-related construction spending fell 9.4% for the month and 4.6% from August 2014
To view the previous spending report, click here.
Related Stories

Giants 400 | Sep 9, 2019
2019 Industrial Sector Giants Report: Managing last mile delivery
This and more industrial building sector trends from Building Design+Construction's 2019 Giants 300 Report.

Codes and Standards | Sep 9, 2019
Free app calculates maximum allowable heights and areas for buildings
A free app that calculates the maximum allowable heights and areas for buildings of various occupancy classifications and types of construction has been released.

Retail Centers | Sep 6, 2019
Another well-known retailer files for bankruptcy: Here's the solution to more empty anchor stores
Where can you find the future of retail? At the intersection of experience and instant gratification.

Giants 400 | Sep 5, 2019
Top 85 Hotel Sector Construction Firms for 2019
Suffolk, Yates Companies, AECOM, Swinerton, and Turner top the rankings of the nation's largest hotel sector contractors and construction management firms, as reported in Building Design+Construction's 2019 Giants 300 Report.
Contractors | Sep 5, 2019
Katerra adds two GCs to its stable
UEB Builders and Fortune-Johnson General Contractors specialize in multifamily and mixed-used developments.

Giants 400 | Sep 4, 2019
Top 90 K-12 School Sector Construction Firms for 2019
Gilbane, Balfour Beatty, Turner, CORE Construction, and Skanska lead the rankings of the nation's largest K-12 school sector contractors and construction management firms, as reported in Building Design+Construction's 2019 Giants 300 Report.

Market Data | Sep 3, 2019
Nonresidential construction spending slips in July 2019, but still surpasses $776 billion
Construction spending declined 0.3% in July, totaling $776 billion on a seasonally adjusted annualized basis.

Giants 400 | Aug 30, 2019
2019 K-12 School Giants Report: 360-degree learning among top school design trends for 2019
K-12 school districts are emphasizing practical, hands-on experience and personalized learning.

Industry Research | Aug 29, 2019
Construction firms expect labor shortages to worsen over the next year
A new AGC-Autodesk survey finds more companies turning to technology to support their jobsites.

Codes and Standards | Aug 29, 2019
Industry leaders ask for government help as trades shortage worsens
AGC asks for more funding for education and increased immigration to fill gaps.


