


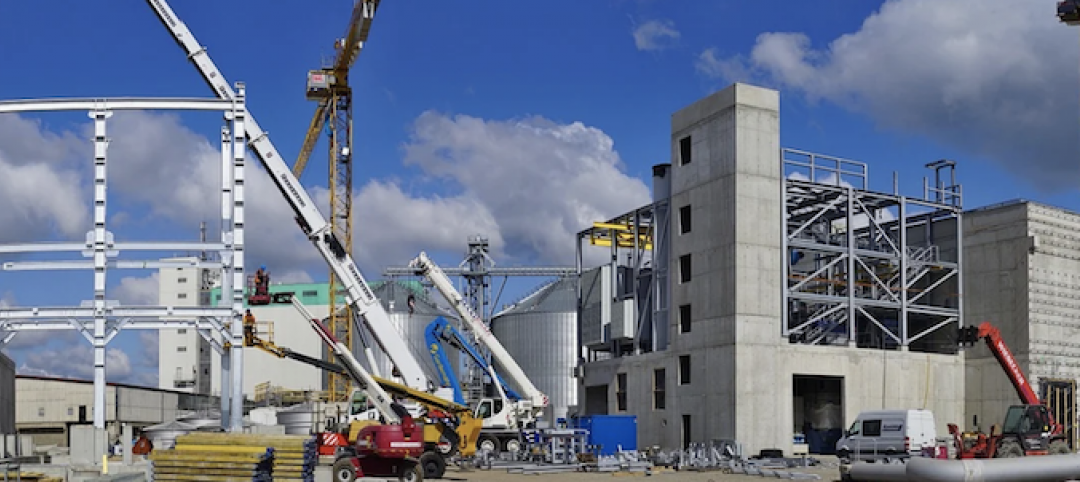
According to an Associated Builders and Contractors analysis of U.S. Census Bureau data released today, national nonresidential construction spending rose 0.3% in April, totaling $792.6 billion on a seasonally adjusted annualized basis, which is a 6.4% increase compared to the same time last year. While public nonresidential spending expanded 4.8% on a monthly basis and increased 15.4% since April 2018, private nonresidential spending fell 2.9% in April and is up just 0.6 % year-over-year.
Among the 16 nonresidential construction spending categories, nine experienced an increase in monthly spending, with the largest increases registered in water supply (9.8%), highway and street (6.8%) and transportation (3.9%). Manufacturing (-7.1%) and commercial (-3.7%) experienced the largest decreases in April, though manufacturing spending is still up 10.9% compared to the same time last year.

“Today’s data release shows that nonresidential construction spending remains vigorous in America,” said ABC Chief Economist Anirban Basu. “While April’s monthly nonresidential construction spending growth of 0.3 percent appears lackluster, this was largely the result of a sizeable upward revision to March construction spending figures.
“Today’s data release also indicates that the baton has now been fully passed,” said Basu. “Earlier in the recovery, nonresidential construction spending growth was primarily driven by private segments. Low interest rates and abundant liquidity helped fuel private investment in hotels, data centers, casinos, fulfillment centers and other forms of private construction. But over the past year, private nonresidential construction spending has barely budged. Meanwhile, public residential spending is up 15.4 percent and April’s spending growth was led by water supply and highway/street.
“Given current levels of backlog, which expanded to 9.5 months in March 2019, nonresidential construction spending should remain elevated,” said Basu. “That said, risks of recession in 2020 are rapidly rising, which has the potential to reduce construction activity in 2021 and/or 2022.”
Related Stories

Market Data | Aug 4, 2020
7 must reads for the AEC industry today: August 4, 2020
Construction spending decreases for fourth consecutive month and 100% affordable housing development breaks ground in Mountain View.
Market Data | Aug 3, 2020
Construction spending decreases for fourth consecutive month in June
Association officials warn further contraction is likely unless federal government enacts prompt, major investment in infrastructure as state and local governments face deficits.

Market Data | Aug 3, 2020
6 must reads for the AEC industry today: August 3, 2020
The future is a number game for retail and restaurants and 5 reasons universities are renovating student housing.

Market Data | Jul 31, 2020
5 must reads for the AEC industry today: July 31, 2020
Vegas's newest resort and casino is packed with contactless technology and Mariott, Hilton, and IHG dominate the U.S. hotel construction pipeline.

Market Data | Jul 30, 2020
Marriott, Hilton, and IHG continue to dominate the U.S. hotel construction pipeline at Q2’20 close
Hilton’s Home2 Suites and IHG’s Holiday Inn Express continue to be the most prominent brands in the U.S. pipeline.

Market Data | Jul 30, 2020
7 must reads for the AEC industry today: July 30, 2020
Millennium Tower finally has a fix and construction costs decrease for the first time in 10 years.
Market Data | Jul 29, 2020
62% of metros shed construction jobs from June 2019 to June 2020 as Association calls for new infrastructure funding, other relief steps
New York City and Brockton-Bridgewater-Easton, Mass. have worst 12-month losses, while Austin and Walla Walla, Wash. top job gainers.

Market Data | Jul 29, 2020
6 must reads for the AEC industry today: July 29, 2020
The world's first net-zero airport and California utility adopts climate emergency declaration.

Market Data | Jul 28, 2020
For the fourth consecutive quarter, Los Angeles leads the U.S. hotel construction pipeline at the close of Q2’ 20
New York City continues to have the greatest number of projects under construction, with 106 projects/18,354 rooms.

Market Data | Jul 28, 2020
6 must reads for the AEC industry today: July 28, 2020
St. Petersburg Pier reconstruction completes and post-pandemic workplace design will not be the same for all.


