


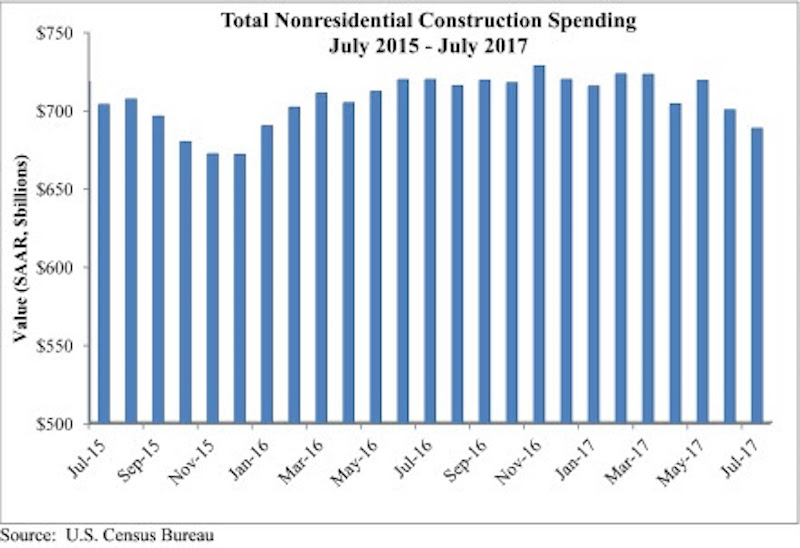
Nonresidential construction spending fell 1.7% in July, totaling $688.4 billion on a seasonally adjusted, annualized basis, according to an analysis by Associated Builders and Contractors (ABC) of data recently released by the U.S. Census Bureau. The absolute level of nonresidential construction spending was at its lowest point since December 2015.
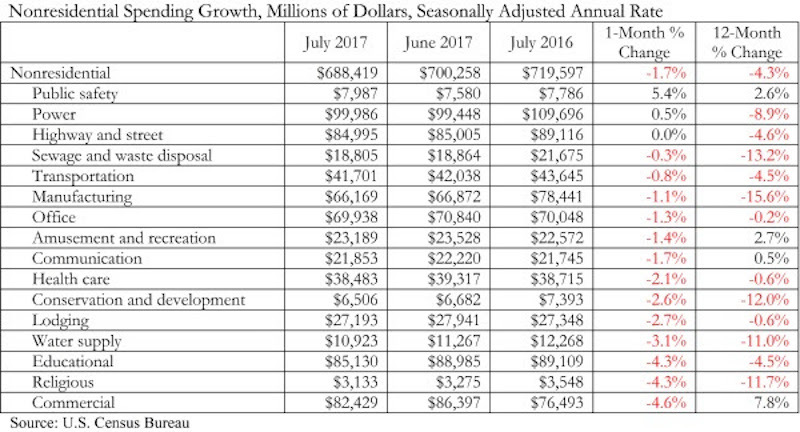
Weakness in spending was widespread. 13 of the 16 nonresidential subsectors contracted for the month. Only the public safety and power categories experienced monthly increases, while the highway and street category remained unchanged for the month. However, May and June nonresidential spending was revised upward by a collective $11 billion.
“As a society, we collect and report data in order to clarify the nature of our circumstances and how they are changing,” said ABC Chief Economist Anirban Basu. “However, recently received data have muddied, not clarified, our collective understanding of how well the nation’s nonresidential construction sector is performing.
 Courtesy ABC.
“Earlier today, we received information indicating that hiring among nonresidential construction firms was brisk in August,” said Basu. “Job growth was significant among nonresidential construction specialty trade contractors and heavy and civil engineering firms, among others. Interpreted independently, this would suggest growing activity in private and public segments.
“But today’s construction spending report points in precisely the opposite direction. Based on that data, nonresidential construction activity has been trending lower since early 2017,” said Basu. “A number of private segments that had been generating significant growth in opportunities for contractors saw activity dwindle in July, including office (-1.3%), lodging (-2.7%), and amusement and recreation (-1.4%). For economists and other stakeholders, the question now is whether today’s jobs report tells the tale or today’s spending data are a better indicator.
“Based on consideration of other factors, including leading indicators, the narrative suggesting that construction activity continues to rise seems more reasonable,” said Basu. “Anecdotally and in survey data, many nonresidential construction firms continue to report healthy backlog and are looking forward to an active 2018. Moreover, recent events in Texas and Louisiana imply that negative trends in nonresidential construction spending will be reversed as rebuilding commences.”
 Courtesy ABC.
Related Stories

Market Data | Mar 26, 2020
Senate coronavirus relief bill's tax and lending provisions will help construction firms, but industry needs additional measures
Construction officials say measure will help firms cope with immediate cash flow crunch, but industry needs compensation for losses.

Market Data | Mar 25, 2020
Engineering and construction materials prices fall for first time in 40 months on coronavirus impacts, IHS Markit says
Survey respondents reported falling prices for five out of the 12 components within the materials and equipment sub-index.

Market Data | Mar 23, 2020
Coronavirus will reshape UAE construction
The impact of the virus has been felt in the UAE, where precautionary measures have been implemented to combat the spread of the virus through social distancing.

Coronavirus | Mar 20, 2020
Pandemic has halted or delayed projects for 28% of contractors
Coronavirus-caused slowdown contrasts with January figures showing a majority of metro areas added construction jobs; Officials note New infrastructure funding and paid family leave fixes are needed.

Market Data | Mar 17, 2020
Construction spending to grow modestly in 2020, predicts JLL’s annual outlook
But the coronavirus has made economic forecasting perilous.

Market Data | Mar 16, 2020
Grumman/Butkus Associates publishes 2019 edition of Hospital Benchmarking Survey
Report examines electricity, fossil fuel, water/sewer, and carbon footprint.

Market Data | Mar 12, 2020
New study from FMI and Autodesk finds construction organizations with the highest levels of trust perform twice as well on crucial business metrics
Higher levels of trust within organizations and across project teams correlate with increased profit margins, employee retention and repeat business that can all add up to millions of dollars of profitability annually.

Market Data | Mar 11, 2020
The global hotel construction pipeline hits record high at 2019 year-end
Projects currently under construction stand at a record 991 projects with 224,354 rooms.

Market Data | Mar 6, 2020
Construction employment increases by 43,000 in February and 223,000 over 12 months
Average hourly earnings in construction top private sector average by 9.9% as construction firms continue to boost pay and benefits in effort to attract and retain qualified hourly craft workers.

Market Data | Mar 4, 2020
Nonresidential construction spending attains all-time high in January
Private nonresidential spending rose 0.8% on a monthly basis and is up 0.5% compared to the same time last year.


