


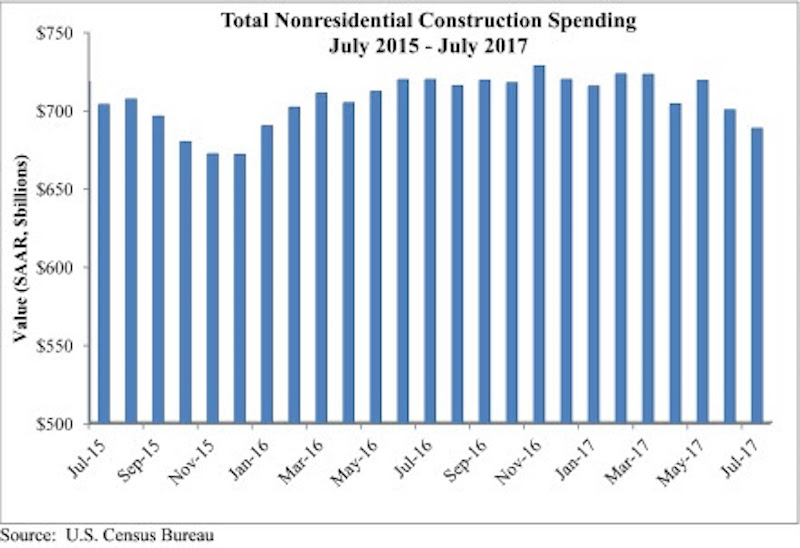
Nonresidential construction spending fell 1.7% in July, totaling $688.4 billion on a seasonally adjusted, annualized basis, according to an analysis by Associated Builders and Contractors (ABC) of data recently released by the U.S. Census Bureau. The absolute level of nonresidential construction spending was at its lowest point since December 2015.
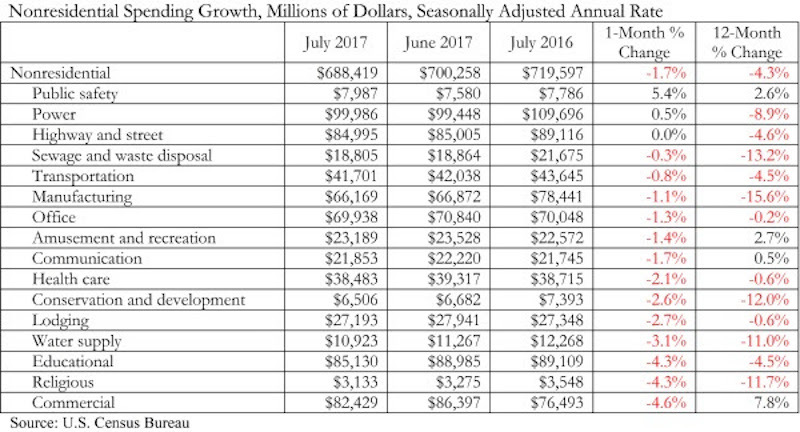
Weakness in spending was widespread. 13 of the 16 nonresidential subsectors contracted for the month. Only the public safety and power categories experienced monthly increases, while the highway and street category remained unchanged for the month. However, May and June nonresidential spending was revised upward by a collective $11 billion.
“As a society, we collect and report data in order to clarify the nature of our circumstances and how they are changing,” said ABC Chief Economist Anirban Basu. “However, recently received data have muddied, not clarified, our collective understanding of how well the nation’s nonresidential construction sector is performing.
 Courtesy ABC.
“Earlier today, we received information indicating that hiring among nonresidential construction firms was brisk in August,” said Basu. “Job growth was significant among nonresidential construction specialty trade contractors and heavy and civil engineering firms, among others. Interpreted independently, this would suggest growing activity in private and public segments.
“But today’s construction spending report points in precisely the opposite direction. Based on that data, nonresidential construction activity has been trending lower since early 2017,” said Basu. “A number of private segments that had been generating significant growth in opportunities for contractors saw activity dwindle in July, including office (-1.3%), lodging (-2.7%), and amusement and recreation (-1.4%). For economists and other stakeholders, the question now is whether today’s jobs report tells the tale or today’s spending data are a better indicator.
“Based on consideration of other factors, including leading indicators, the narrative suggesting that construction activity continues to rise seems more reasonable,” said Basu. “Anecdotally and in survey data, many nonresidential construction firms continue to report healthy backlog and are looking forward to an active 2018. Moreover, recent events in Texas and Louisiana imply that negative trends in nonresidential construction spending will be reversed as rebuilding commences.”
 Courtesy ABC.
Related Stories
Market Data | Jul 16, 2024
Construction spending expected to rise, despite labor and materials snags
In the first half of 2024, construction costs stabilized. And through the remainder of this year, total cost growth is projected to be modest, and matched by an overall increase in construction spending. That prediction can be found in JLL’s 2024 Midyear Construction Update and Reforecast.

Healthcare Facilities | Jul 11, 2024
New download: BD+C's 2024 Healthcare Annual Report
Welcome to Building Design+Construction’s 2024 Healthcare Annual Report. This free 66-page special report is our first-ever “state of the state” update on the $65 billion healthcare construction sector.

Contractors | Jul 9, 2024
The average U.S. contractor has 8.4 months worth of construction work in the pipeline, as of June 2024
Associated Builders and Contractors reported today that its Construction Backlog Indicator increased to 8.4 months in June, according to an ABC member survey conducted June 20 to July 3. The reading is down 0.5 months from June 2023.

Office Buildings | Jul 8, 2024
Office vacancy peak of 22% to 28% forecasted for 2026
The work from home trend will continue to put pressure on the office real estate market, with peak vacancy of between 22% and 28% in 2026, according to a forecast by Moody’s.

Apartments | Jun 25, 2024
10 hardest places to find an apartment in 2024
The challenge of finding an available rental continues to increase for Americans nation-wide. On average, there are eight prospective tenants vying for the same vacant apartment.

Contractors | Jun 12, 2024
The average U.S. contractor has 8.3 months worth of construction work in the pipeline, as of May 2024
Associated Builders and Contractors reported that its Construction Backlog Indicator fell to 8.3 months in May, according to an ABC member survey conducted May 20 to June 4. The reading is down 0.6 months from May 2023.

MFPRO+ News | Jun 11, 2024
Rents rise in multifamily housing for May 2024
Multifamily rents rose for the fourth month in a row, according to the May 2024 National Multifamily Report. Up 0.6% year-over-year, the average U.S. asking rent increased by $6 in May, up to $1,733.

Construction Costs | May 16, 2024
New download: BD+C's May 2024 Market Intelligence Report
Building Design+Construction's monthly Market Intelligence Report offers a snapshot of the health of the U.S. building construction industry, including the commercial, multifamily, institutional, and industrial building sectors. This report tracks the latest metrics related to construction spending, demand for design services, contractor backlogs, and material price trends.

Contractors | May 15, 2024
The average U.S. contractor has 8.4 months worth of construction work in the pipeline, as of April 2024
Associated Builders and Contractors reported that its Construction Backlog Indicator increased to 8.4 months in April, according to an ABC member survey conducted April 22 to May 6. The reading is down 0.5 months from April 2023, but expanded 0.2 months from the prior month.

Healthcare Facilities | May 6, 2024
Hospital construction costs for 2024
Data from Gordian breaks down the average cost per square foot for a three-story hospital across 10 U.S. cities.


