


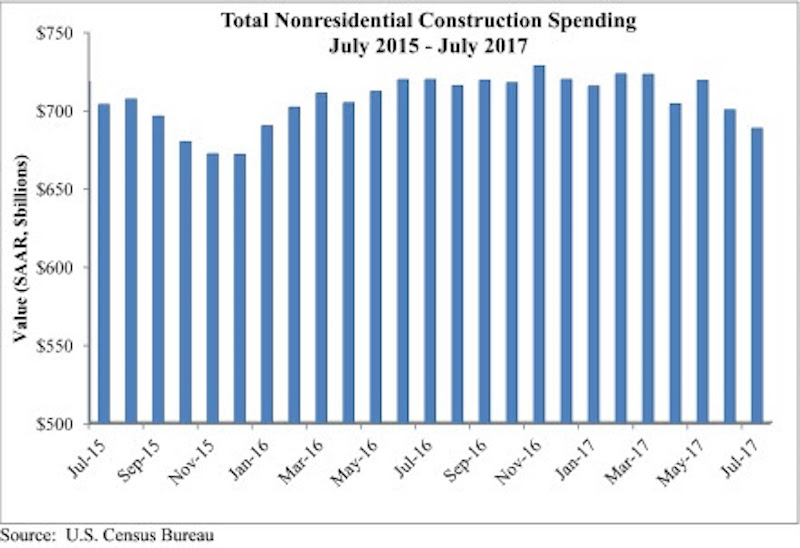
Nonresidential construction spending fell 1.7% in July, totaling $688.4 billion on a seasonally adjusted, annualized basis, according to an analysis by Associated Builders and Contractors (ABC) of data recently released by the U.S. Census Bureau. The absolute level of nonresidential construction spending was at its lowest point since December 2015.
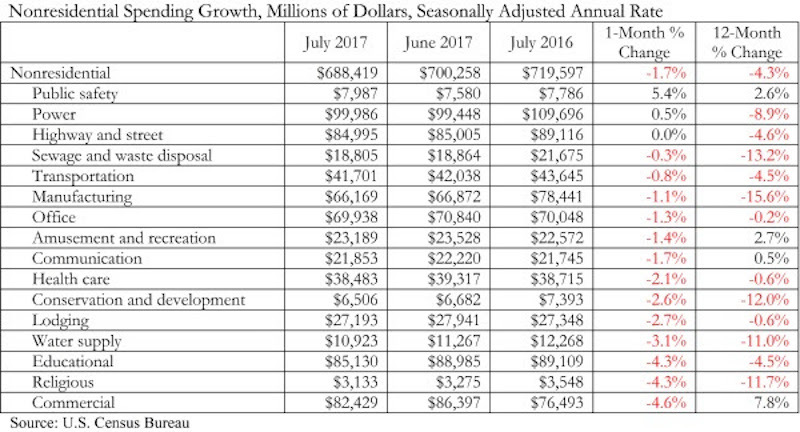
Weakness in spending was widespread. 13 of the 16 nonresidential subsectors contracted for the month. Only the public safety and power categories experienced monthly increases, while the highway and street category remained unchanged for the month. However, May and June nonresidential spending was revised upward by a collective $11 billion.
“As a society, we collect and report data in order to clarify the nature of our circumstances and how they are changing,” said ABC Chief Economist Anirban Basu. “However, recently received data have muddied, not clarified, our collective understanding of how well the nation’s nonresidential construction sector is performing.
 Courtesy ABC.
“Earlier today, we received information indicating that hiring among nonresidential construction firms was brisk in August,” said Basu. “Job growth was significant among nonresidential construction specialty trade contractors and heavy and civil engineering firms, among others. Interpreted independently, this would suggest growing activity in private and public segments.
“But today’s construction spending report points in precisely the opposite direction. Based on that data, nonresidential construction activity has been trending lower since early 2017,” said Basu. “A number of private segments that had been generating significant growth in opportunities for contractors saw activity dwindle in July, including office (-1.3%), lodging (-2.7%), and amusement and recreation (-1.4%). For economists and other stakeholders, the question now is whether today’s jobs report tells the tale or today’s spending data are a better indicator.
“Based on consideration of other factors, including leading indicators, the narrative suggesting that construction activity continues to rise seems more reasonable,” said Basu. “Anecdotally and in survey data, many nonresidential construction firms continue to report healthy backlog and are looking forward to an active 2018. Moreover, recent events in Texas and Louisiana imply that negative trends in nonresidential construction spending will be reversed as rebuilding commences.”
 Courtesy ABC.
Related Stories

Market Data | Apr 6, 2023
JLL’s 2023 Construction Outlook foresees growth tempered by cost increases
The easing of supply chain snags for some product categories, and the dispensing with global COVID measures, have returned the North American construction sector to a sense of normal. However, that return is proving to be complicated, with the construction industry remaining exceptionally busy at a time when labor and materials cost inflation continues to put pricing pressure on projects, leading to caution in anticipation of a possible downturn. That’s the prognosis of JLL’s just-released 2023 U.S. and Canada Construction Outlook.

Market Data | Apr 4, 2023
Nonresidential construction spending up 0.4% in February 2023
National nonresidential construction spending increased 0.4% in February, according to an Associated Builders and Contractors analysis of data published by the U.S. Census Bureau. On a seasonally adjusted annualized basis, nonresidential spending totaled $982.2 billion for the month, up 16.8% from the previous year.

Multifamily Housing | Mar 24, 2023
Average size of new apartments dropped sharply in 2022
The average size of new apartments in 2022 dropped sharply in 2022, as tracked by RentCafe. Across the U.S., the average new apartment size was 887 sf, down 30 sf from 2021, which was the largest year-over-year decrease.

Multifamily Housing | Mar 14, 2023
Multifamily housing rent rates remain flat in February 2023
Multifamily housing asking rents remained the same for a second straight month in February 2023, at a national average rate of $1,702, according to the new National Multifamily Report from Yardi Matrix. As the economy continues to adjust in the post-pandemic period, year-over-year growth continued its ongoing decline.

Contractors | Mar 14, 2023
The average U.S. contractor has 9.2 months worth of construction work in the pipeline, as of February 2023
Associated Builders and Contractors reported today that its Construction Backlog Indicator increased to 9.2 months in February, according to an ABC member survey conducted Feb. 20 to March 6. The reading is 1.2 months higher than in February 2022.

Industry Research | Mar 9, 2023
Construction labor gap worsens amid more funding for new infrastructure, commercial projects
The U.S. construction industry needs to attract an estimated 546,000 additional workers on top of the normal pace of hiring in 2023 to meet demand for labor, according to a model developed by Associated Builders and Contractors. The construction industry averaged more than 390,000 job openings per month in 2022.

Market Data | Mar 7, 2023
AEC employees are staying with firms that invest in their brand
Hinge Marketing’s latest survey explores workers’ reasons for leaving, and offers strategies to keep them in the fold.

Multifamily Housing | Feb 21, 2023
Multifamily housing investors favoring properties in the Sun Belt
Multifamily housing investors are gravitating toward Sun Belt markets with strong job and population growth, according to new research from Yardi Matrix. Despite a sharp second-half slowdown, last year’s nationwide $187 billion transaction volume was the second-highest annual total ever.

Contractors | Feb 14, 2023
The average U.S. contractor has nine months worth of construction work in the pipeline
Associated Builders and Contractors reports today that its Construction Backlog Indicator declined 0.2 months to 9.0 in January, according to an ABC member survey conducted Jan. 20 to Feb. 3. The reading is 1.0 month higher than in January 2022.

Office Buildings | Feb 9, 2023
Post-Covid Manhattan office market rebound gaining momentum
Office workers in Manhattan continue to return to their workplaces in sufficient numbers for many of their employers to maintain or expand their footprint in the city, according to a survey of more than 140 major Manhattan office employers conducted in January by The Partnership for New York City.


