

From July through October of 2020, national construction costs rose, on average, by 0.25%, based on 14 markets in North America tracked by the construction consulting firm Rider Levett Bucknall (RLB), which has just released its North America Construction Cost report for the fourth quarter of 2020.
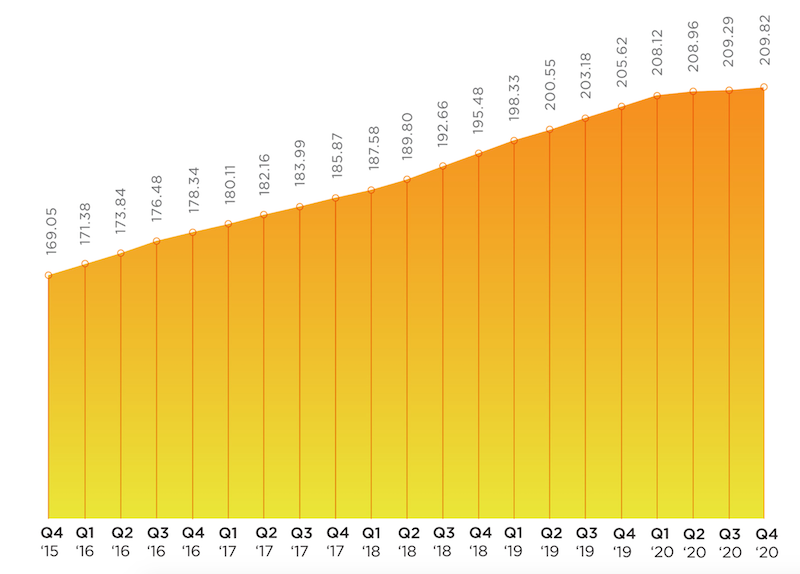
Over the first 10 months of last year, construction spending rose by 3.7% to $1.439 trillion, according to Census Bureau estimates. Construction costs were up by 2.03%. RLB’s National Construction Cost Index stood at 209.82 for the fourth quarter of last year, compared to 205.62 for the same period a year earlier. After rising consistently since the fourth quarter of 2015, RLB’s Index tapered off last year.
The full report can be downloaded from here.
Given the impact of construction activity from the coronavirus pandemic, “the economic damage incurred over the past nine months will take time to heal,” writes Julian Anderson, FRICS, President-North America for RLB.
Anderson expresses concern about lingering unemployment that is “casting a darker shadow over the economy.” He speaks optimistically about President-Elect Joe Biden’s expansive infrastructure plan, whose passage became more likely now that Democrats will control the executive and legislative branches following the election of two Democratic senators in Georgia earlier this month.

For the most part, inflation is under control in the construction sectors of U.S. metros.
Anderson predicts that Biden’s plan will receive bipartisan support “if it is tied to creating jobs that have been lost due to the pandemic.” The New York Times, quoting Bureau of Labor Statistics estimates, reported on January 9 that 9.4 million jobs were lost in the U.S. in 2020, the worst year since World War II.
Construction unemployment, which spiked in the second quarter when the coronavirus delayed or postponed projects, has recovered of late. The industry gained 51,00 jobs in December, even though the total for the year was down 142,000, or 1.9%. However, a survey that included 1,329 responses, conducted by Associated General Contractors of America (AGC) in every state from Nov. 11 through Dec. 11, found that contractors are generally pessimistic about the outlook for nonresidential and multifamily construction in 2021.
SAN FRANCISCO STILL COSTLIEST MARKET
RLB’s report breaks down its Cost Index by cities and building types. For example, San Francisco, New York, and Boston registered the highest indices for prime office construction. Chicago, Honolulu, and San Francisco had the highest cost indices for five-star hotels. Los Angeles is the most expensive market in which to build hospitals, in part because of California’s seismic mitigation requirements.

This chart shows the relative costs of materials and labor as bid in markets around the U.S., and the average percentage change from October 2019 to October 2020.
San Francisco and Los Angeles had the highest indices for the Industrial sector, Sn Francisco and Seattle for multifamily costs, and Honolulu and New York for costs attendant to building high schools.
All told, Chicago, Boston, New York, Portland, and San Francisco all experienced cost increases that were higher than the national average in the latest quarter, even though Chicago’s Cost Index was lower, by 1.29%, for the year. Conversely, Los Angeles experienced the highest October 2019-October 2020 increase in its Cost Index, 4.41%, despite a slight decline in the latest quarter. And for the year, San Francisco had the highest “as bid” index measuring a representative sampling of materials and labor among the markets tracked.
Denver, Seattle, and Washington D.C. saw quarterly increases that were below the national average for construction costs.
Related Stories

Market Data | Feb 27, 2018
AIA small firm report: Half of employees have ownership stake in their firm
The American Institute of Architects has released its first-ever Small Firm Compensation Report.

Market Data | Feb 21, 2018
Strong start for architecture billings in 2018
The American Institute of Architects reported the January 2018 ABI score was 54.7, up from a score of 52.8 in the previous month.

Multifamily Housing | Feb 15, 2018
United States ranks fourth for renter growth
Renters are on the rise in 21 of the 30 countries examined in RentCafé’s recent study.

Market Data | Feb 1, 2018
Nonresidential construction spending expanded 0.8% in December, brighter days ahead
“The tax cut will further bolster liquidity and confidence, which will ultimately translate into more construction starts and spending,” said ABC Chief Economist Anirban Basu.

Green | Jan 31, 2018
U.S. Green Building Council releases annual top 10 states for LEED green building per capita
Massachusetts tops the list for the second year; New York, Hawaii and Illinois showcase leadership in geographically diverse locations.

Industry Research | Jan 30, 2018
AIA’s Kermit Baker: Five signs of an impending upturn in construction spending
Tax reform implications and rebuilding from natural disasters are among the reasons AIA’s Chief Economist is optimistic for 2018 and 2019.

Market Data | Jan 30, 2018
AIA Consensus Forecast: 4.0% growth for nonresidential construction spending in 2018
The commercial office and retail sectors will lead the way in 2018, with a strong bounce back for education and healthcare.

Market Data | Jan 29, 2018
Year-end data show economy expanded in 2017; Fixed investment surged in fourth quarter
The economy expanded at an annual rate of 2.6% during the fourth quarter of 2017.

Market Data | Jan 25, 2018
Renters are the majority in 42 U.S. cities
Over the past 10 years, the number of renters has increased by 23 million.

Market Data | Jan 24, 2018
HomeUnion names the most and least affordable rental housing markets
Chicago tops the list as the most affordable U.S. metro, while Oakland, Calif., is the most expensive rental market.


