

From July through October of 2020, national construction costs rose, on average, by 0.25%, based on 14 markets in North America tracked by the construction consulting firm Rider Levett Bucknall (RLB), which has just released its North America Construction Cost report for the fourth quarter of 2020.
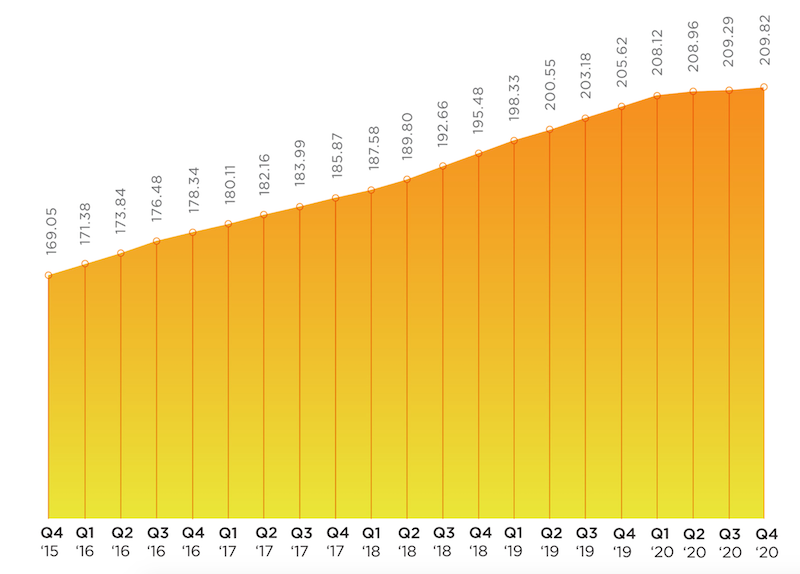
Over the first 10 months of last year, construction spending rose by 3.7% to $1.439 trillion, according to Census Bureau estimates. Construction costs were up by 2.03%. RLB’s National Construction Cost Index stood at 209.82 for the fourth quarter of last year, compared to 205.62 for the same period a year earlier. After rising consistently since the fourth quarter of 2015, RLB’s Index tapered off last year.
The full report can be downloaded from here.
Given the impact of construction activity from the coronavirus pandemic, “the economic damage incurred over the past nine months will take time to heal,” writes Julian Anderson, FRICS, President-North America for RLB.
Anderson expresses concern about lingering unemployment that is “casting a darker shadow over the economy.” He speaks optimistically about President-Elect Joe Biden’s expansive infrastructure plan, whose passage became more likely now that Democrats will control the executive and legislative branches following the election of two Democratic senators in Georgia earlier this month.

For the most part, inflation is under control in the construction sectors of U.S. metros.
Anderson predicts that Biden’s plan will receive bipartisan support “if it is tied to creating jobs that have been lost due to the pandemic.” The New York Times, quoting Bureau of Labor Statistics estimates, reported on January 9 that 9.4 million jobs were lost in the U.S. in 2020, the worst year since World War II.
Construction unemployment, which spiked in the second quarter when the coronavirus delayed or postponed projects, has recovered of late. The industry gained 51,00 jobs in December, even though the total for the year was down 142,000, or 1.9%. However, a survey that included 1,329 responses, conducted by Associated General Contractors of America (AGC) in every state from Nov. 11 through Dec. 11, found that contractors are generally pessimistic about the outlook for nonresidential and multifamily construction in 2021.
SAN FRANCISCO STILL COSTLIEST MARKET
RLB’s report breaks down its Cost Index by cities and building types. For example, San Francisco, New York, and Boston registered the highest indices for prime office construction. Chicago, Honolulu, and San Francisco had the highest cost indices for five-star hotels. Los Angeles is the most expensive market in which to build hospitals, in part because of California’s seismic mitigation requirements.

This chart shows the relative costs of materials and labor as bid in markets around the U.S., and the average percentage change from October 2019 to October 2020.
San Francisco and Los Angeles had the highest indices for the Industrial sector, Sn Francisco and Seattle for multifamily costs, and Honolulu and New York for costs attendant to building high schools.
All told, Chicago, Boston, New York, Portland, and San Francisco all experienced cost increases that were higher than the national average in the latest quarter, even though Chicago’s Cost Index was lower, by 1.29%, for the year. Conversely, Los Angeles experienced the highest October 2019-October 2020 increase in its Cost Index, 4.41%, despite a slight decline in the latest quarter. And for the year, San Francisco had the highest “as bid” index measuring a representative sampling of materials and labor among the markets tracked.
Denver, Seattle, and Washington D.C. saw quarterly increases that were below the national average for construction costs.
Related Stories

Market Data | Jul 11, 2018
Construction material prices increase steadily in June
June represents the latest month associated with rapidly rising construction input prices.

Market Data | Jun 26, 2018
Yardi Matrix examines potential regional multifamily supply overload
Outsize development activity in some major metros could increase vacancy rates and stagnate rent growth.

Market Data | Jun 22, 2018
Multifamily market remains healthy – Can it be sustained?
New report says strong economic fundamentals outweigh headwinds.

Market Data | Jun 21, 2018
Architecture firm billings strengthen in May
Architecture Billings Index enters eighth straight month of solid growth.

Market Data | Jun 20, 2018
7% year-over-year growth in the global construction pipeline
There are 5,952 projects/1,115,288 rooms under construction, up 8% by projects YOY.

Market Data | Jun 19, 2018
ABC’s Construction Backlog Indicator remains elevated in first quarter of 2018
The CBI shows highlights by region, industry, and company size.

Market Data | Jun 19, 2018
America’s housing market still falls short of providing affordable shelter to many
The latest report from the Joint Center for Housing Studies laments the paucity of subsidies to relieve cost burdens of ownership and renting.

Market Data | Jun 18, 2018
AI is the path to maximum profitability for retail and FMCG firms
Leading retailers including Amazon, Alibaba, Lowe’s and Tesco are developing their own AI solutions for automation, analytics and robotics use cases.

Market Data | Jun 12, 2018
Yardi Matrix report details industrial sector's strength
E-commerce and biopharmaceutical companies seeking space stoke record performances across key indicators.

Market Data | Jun 8, 2018
Dodge Momentum Index inches up in May
May’s gain was the result of a 4.7% increase by the commercial component of the Momentum Index.


