


According to Lodging Econometrics’ (LE) most recent construction pipeline trend report, at the close of the second quarter, the top five markets with the largest hotel construction pipelines are New York City, with 146 projects/25,232 rooms; Los Angeles with 135 projects/22,586 rooms; Dallas with 132 projects/16,183 rooms; Atlanta with 129 projects/17,845 rooms; and Nashville with 91 projects/12,703 rooms.
The five top markets with the most projects currently under construction are New York City with 111 projects/19,582 rooms, Atlanta with 39 projects/5,795 rooms, Los Angeles with 34 projects/5,771 rooms, Dallas with 30 projects/4,173 rooms, and Austin with 29 projects/3,768 rooms. These five markets collectively account for nearly 25% of the total number of rooms currently under construction in the U.S.
According to LE’s research, many hotel owners, developers, and management groups have used the operational downtime, caused by COVID-19’s impact on operating performance, as an opportunity to upgrade and renovate their hotels and/or redefine their hotels with a brand conversion. In the second quarter of 2021, LE recorded a combined renovation and conversion total of 1,135 active projects with 176,445 rooms for the U.S. The markets with the largest combined number of renovations and conversions are New York with 25 projects/7,957 rooms, Houston with 24 projects/3,549 rooms, Los Angeles with 24 projects/3,423 rooms, Chicago with 20 projects/2,803 rooms, and Miami with 19 projects/2,305 rooms.
Despite previous, and in some cases, ongoing delays in the pipeline, and with the recent changes to travel restrictions and the summer travel season upon us, many developers are feeling more optimistic about the future of the lodging industry as new hotel announcements continue. In the second quarter of 2021, Memphis recorded the highest count of new projects announced into the pipeline with 8 projects/927 rooms. Austin followed with 7 projects/1,084 rooms, then Atlanta with 6 projects/658 rooms, Washington DC with 5 projects/1,554 rooms, and Miami with 5 projects/499 rooms.
Hotels forecast to open in 2021 are led by New York City with 59 projects/8,583 rooms for a 7.2% supply increase, followed by Orlando with 22 projects/ 3,555 rooms for a 2.6% supply increase, Nashville with 22 projects/2,938 rooms for a 5.7% supply increase, Atlanta with 22 projects/2,930 rooms for a 2.7% supply increase, and then Houston with 22 projects/2,470 rooms for a 2.7% supply increase.
In 2022, New York is forecast to, again, top the list of new hotel openings with 46 projects/7,934 rooms while at this time, Dallas is anticipated to lead in 2023 with 35 projects/4,013 rooms expected to open.
Related Stories
Market Data | Jul 8, 2020
5 must reads for the AEC industry today: July 8, 2020
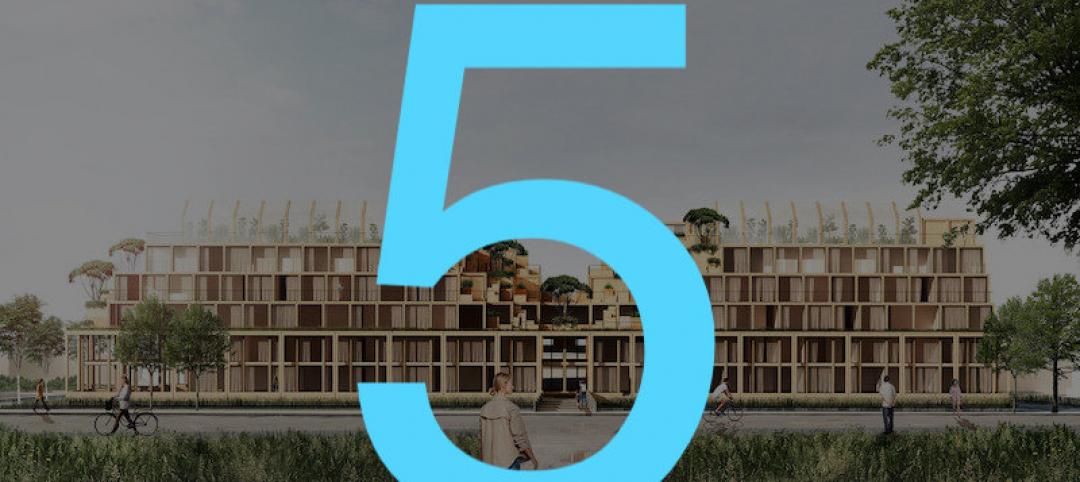
AEMSEN develops concept for sustainable urban living and nonresidential construction has recovered 56% of jobs lost since March.
Market Data | Jul 7, 2020
Nonresidential construction has recovered 56% of jobs lost since March employment report
Nonresidential construction employment added 74,700 jobs on net in June.

Market Data | Jul 7, 2020
7 must reads for the AEC industry today: July 7, 2020
Construction industry adds 158,000 workers in June and mall owners open micro distribution hubs for e-commerce fulfillment.

Market Data | Jul 6, 2020
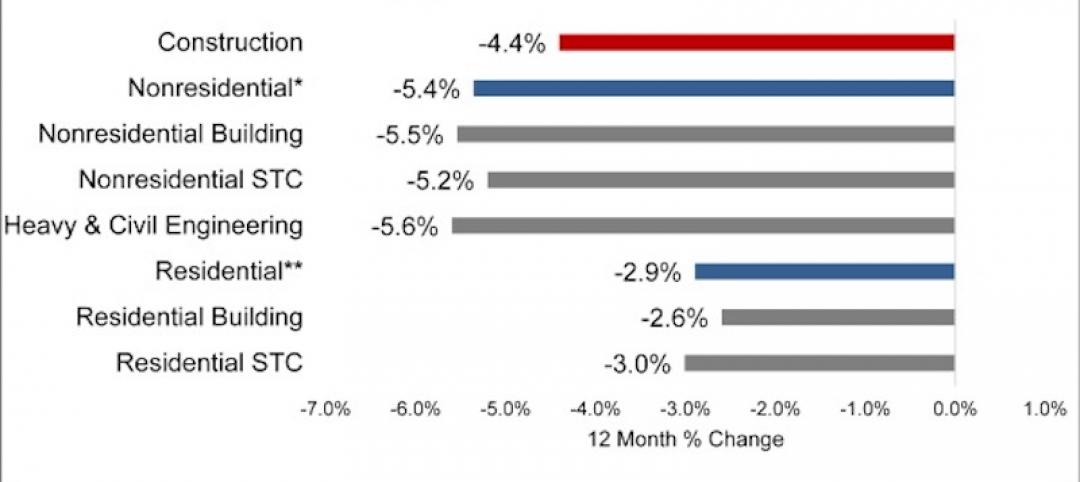
Nonresidential construction spending falls modestly in May
Private nonresidential spending declined 2.4% in May and public nonresidential construction spending increased 1.2%.

Market Data | Jul 6, 2020
Construction industry adds 158,000 workers in June but infrastructure jobs decline
Gains in June are concentrated in homebuilding as state and local governments postpone or cancel roads and other projects in face of looming budget deficits.

Market Data | Jul 6, 2020
5 must reads for the AEC industry today: July 6, 2020
Demand growth for mass timber components and office demand has increased as workers return.

Market Data | Jul 2, 2020
Fall in US construction spending in May shows weakness of country’s construction industry, says GlobalData
Dariana Tani, Economist at GlobalData, a leading data and analytics company, offers her view on the situation

Market Data | Jul 2, 2020
6 must reads for the AEC industry today: July 2, 2020
Construction spending declines 2.1% in May and how physical spaces may adapt to a post-COVID world.

Market Data | Jul 1, 2020
Construction spending declines 2.1% in May as drop in private work outweighs public pickup
Federal infrastructure measure can help offset private-sector demand that is likely to remain below pre-coronavirus levels amid economic uncertainty.

Market Data | Jul 1, 2020
7 must reads for the AEC industry today: July 1, 2020
Facebook to build $800 million data center and 329 metro areas added construction jobs in May.


