


According to Lodging Econometrics’ (LE) most recent construction pipeline trend report, at the close of the second quarter, the top five markets with the largest hotel construction pipelines are New York City, with 146 projects/25,232 rooms; Los Angeles with 135 projects/22,586 rooms; Dallas with 132 projects/16,183 rooms; Atlanta with 129 projects/17,845 rooms; and Nashville with 91 projects/12,703 rooms.
The five top markets with the most projects currently under construction are New York City with 111 projects/19,582 rooms, Atlanta with 39 projects/5,795 rooms, Los Angeles with 34 projects/5,771 rooms, Dallas with 30 projects/4,173 rooms, and Austin with 29 projects/3,768 rooms. These five markets collectively account for nearly 25% of the total number of rooms currently under construction in the U.S.
According to LE’s research, many hotel owners, developers, and management groups have used the operational downtime, caused by COVID-19’s impact on operating performance, as an opportunity to upgrade and renovate their hotels and/or redefine their hotels with a brand conversion. In the second quarter of 2021, LE recorded a combined renovation and conversion total of 1,135 active projects with 176,445 rooms for the U.S. The markets with the largest combined number of renovations and conversions are New York with 25 projects/7,957 rooms, Houston with 24 projects/3,549 rooms, Los Angeles with 24 projects/3,423 rooms, Chicago with 20 projects/2,803 rooms, and Miami with 19 projects/2,305 rooms.
Despite previous, and in some cases, ongoing delays in the pipeline, and with the recent changes to travel restrictions and the summer travel season upon us, many developers are feeling more optimistic about the future of the lodging industry as new hotel announcements continue. In the second quarter of 2021, Memphis recorded the highest count of new projects announced into the pipeline with 8 projects/927 rooms. Austin followed with 7 projects/1,084 rooms, then Atlanta with 6 projects/658 rooms, Washington DC with 5 projects/1,554 rooms, and Miami with 5 projects/499 rooms.
Hotels forecast to open in 2021 are led by New York City with 59 projects/8,583 rooms for a 7.2% supply increase, followed by Orlando with 22 projects/ 3,555 rooms for a 2.6% supply increase, Nashville with 22 projects/2,938 rooms for a 5.7% supply increase, Atlanta with 22 projects/2,930 rooms for a 2.7% supply increase, and then Houston with 22 projects/2,470 rooms for a 2.7% supply increase.
In 2022, New York is forecast to, again, top the list of new hotel openings with 46 projects/7,934 rooms while at this time, Dallas is anticipated to lead in 2023 with 35 projects/4,013 rooms expected to open.
Related Stories

Market Data | Jul 29, 2020
6 must reads for the AEC industry today: July 29, 2020
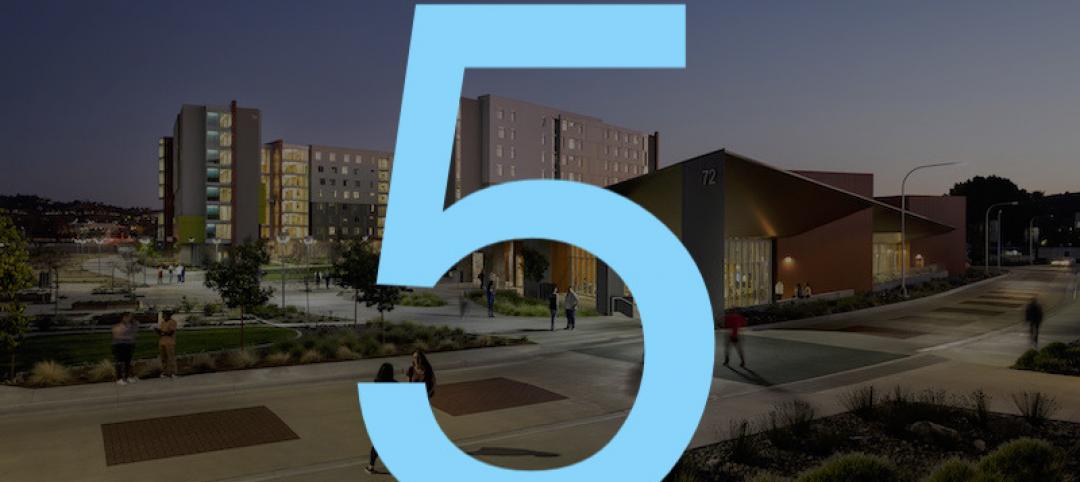
The world's first net-zero airport and California utility adopts climate emergency declaration.

Market Data | Jul 28, 2020
For the fourth consecutive quarter, Los Angeles leads the U.S. hotel construction pipeline at the close of Q2’ 20
New York City continues to have the greatest number of projects under construction, with 106 projects/18,354 rooms.

Market Data | Jul 28, 2020
6 must reads for the AEC industry today: July 28, 2020
St. Petersburg Pier reconstruction completes and post-pandemic workplace design will not be the same for all.

Market Data | Jul 28, 2020
Senate Republicans' coronavirus relief measure includes provisions that will help hard-hit construction firms recover
The HEALS Act includes essential liability, workforce, financial & unemployment reforms, but association will work to get needed infrastructure investments included in final relief measure.

Market Data | Jul 27, 2020
6 must reads for the AEC industry today: July 27, 2020
Customized labs give universities a recruiting edge and the U.S. construction pipeline remains robust through the first half of 2020.

Market Data | Jul 27, 2020
The U.S. construction pipeline remains robust through the first half of 2020, despite pandemic
Projects currently under construction stand at 1,771 projects/235,467 rooms, up 3% and 1% respectively, YOY.
Market Data | Jul 24, 2020
5 must reads for the AEC industry today: July 24, 2020
North Carolina will stop relying on FEMA flood mapping and Cal Poly Pomona's newest project.

Market Data | Jul 23, 2020
New LEED guidance from USGBC helps cities and communities expand resilience efforts in response to the COVID-19 pandemic
Credits integrate public health and social equity with sustainability planning.

Market Data | Jul 23, 2020
6 must reads for the AEC industry today: July 23, 2020
Skanska selects Pickard Chilton to design new ofice tower and days grow long at nursing homes as virus lockdowns drag on.

Market Data | Jul 22, 2020
6 must reads for the AEC industry today: July 22, 2020
Phase one of Toronto's The Orbit detailed and architecture billings remains in negative territory.


