


In the six quarters ended June 30, nearly 95 million square feet of new office space had been delivered in the U.S., and another 25 million sf were under construction for delivery in 2019. With available office space outpacing demand, coupled with a significant flight to quality by companies, landlords are vying for tenants with more generous improvement packages.
Tenant improvement packages, in fact, have helped landlords offset peak rents as well as premium pricing for new construction, whose final price tag continues to be adversely affected by steadily rising materials and labor costs.
Against the backdrop of these dynamics, during what has been the second-longest period of economic expansion in the country’s history, JLL this week released its second annual U.S. and Canada Fit Out Guide and Office Cost Benchmarking Report for 2018, which can be downloaded here.
The guide is based on 2,800 JLL-managed projects for more than 100 clients in 59 markets and 17 industries. Its purpose is to provide a reference for average costs to build out three different office layouts—progressive, moderate, and traditional—within a matrix of high, medium, or base levels of space quality and complexity (see chart).
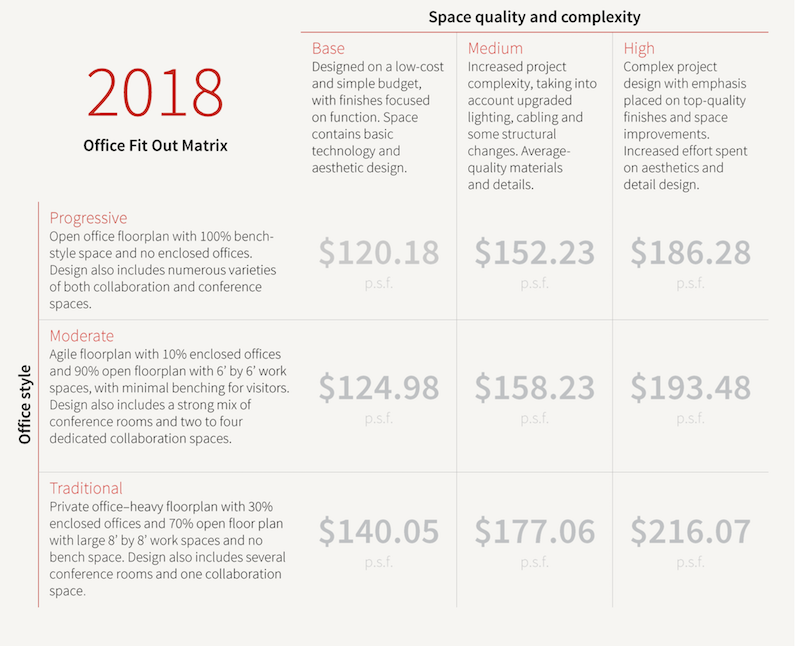
The guide, based on 2,800 projects, compares the different cost structures for three styles and three quality levels of office fit outs. Image: JLL
This year’s guide adds office layout and space quality components that allow users to evaluate how different layouts, project complexities, and materials selections might affect bottom-line costs. JLL also worked closed with its supply-chain and project managers to provide allowances for furniture, fittings and equipment (FF&E), and AV installation. The latest guide also removed contingencies associated with high-level budgeting.
During a teleconference previewing this report, three JLL executives—Scott Kessling, who heads up its Business Intelligence team; Lauren Harsha, Senior Business Intelligence Analyst; and David Barnett, Senior Analyst-Research—explained how decisions about office-space design and fit-out expenditures are being driven by five factors that are dictating the future of work: human experience, financial performance, digital drive (i.e., harnessing digitalization and rich data to enhance people and enterprise performance), continuous innovation, and operational excellence.
Fit out budgets are also being impacted by labor shortages, and by materials costs that last year rose 3.4% and continue upward in 2018, in some cases—like softwood lumber and steel—by double digits.
To help companies determine which fit out style suits their personalities and strategy, JLL calls out key space considerations for each.
The Progressive style is the favored layout for tech companies and startups. It’s open, with 100% benches and no enclosed offices. It can accommodate between 20% to 50% more employees than the Moderate or Traditional style. A standard plan would have 28 conference rooms and seven open collaborative and multi-use spaces. Project budgets for Progressive fit outs tend to be lighter on hard costs due to minimal dividing walls or enclosed offices. And this style saves on traditional FF&E spending.
A Moderate-style fit might work best for a company transitioning into a more efficient office model. It features a mix of workstations and limited (10%) private offices. It can handle between 20% to 25% more employees than a Traditional-style fit out, and its standard plan would include 20 conference rooms and five collaborative spaces. While more expensive per sf than the Progressive style, a Moderate fit out can capture cost efficiencies by integrating a higher percentage of bench-style desks.
Law firms and financial service providers are among the businesses that favor Traditional-style fit outs, where at least 30% of the space is for enclosed offices, and its floor plan features 8x8-ft cubicles. Traditional will have the highest FF&E costs of the three styles. But JLL also points out that tenant factors are comparatively small within a Traditional model due to lessened need for common areas or multi-use space furniture.
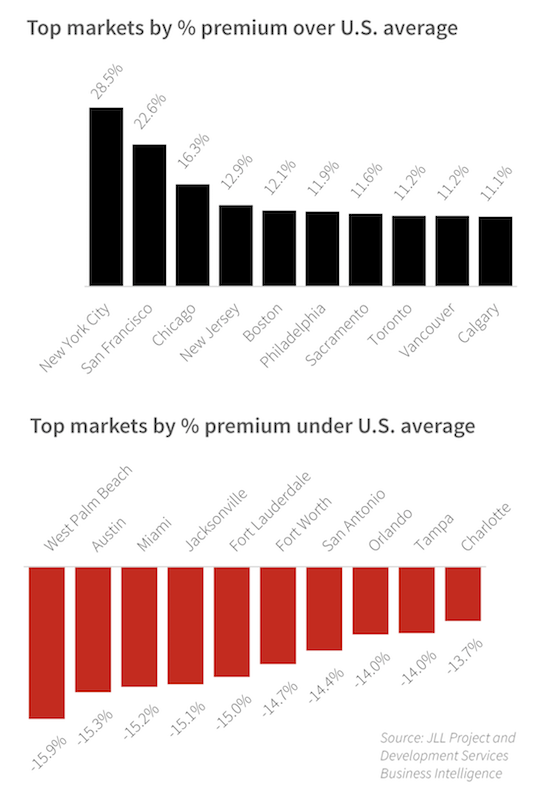
The largest metros are typically the most expensive for office fit outs, but there are still bargains are there, as in Austin, where 3 million sf of new office space is under construction and whose vacancy rate hovers near 11%. Image: JLL
JLL’s report does a deeper dive by offering breakdowns—by 59 metros in the U.S. and Canada, and by fit out style—of hard costs, design and fee costs, FF& costs, and tenant factor costs that are further delineated by base, medium, and high space quality and complexity.
The report then provides more detail on six metros—Austin, Chicago, Los Angeles, New York, San Francisco, and Toronto—that are among the most active places for office construction and redevelopment.
In all six markets, office construction is moving full speed ahead, despite double-digit vacancy rates in four of the six cities. In San Francisco—where 68.8% of new construction is already preleased—absorption rates are expected to rise significantly. In Los Angeles, a big market driver is an expanding digital media sector. And in New York, new supply additions are creating conditions more favorable to renters and are pushing higher-than-ever concessions packages.
Related Stories

Market Data | May 4, 2020
The Los Angeles market continue to lead the U.S. hotel construction pipeline at the close of the first quarter of 2020
Nationally, under construction project counts hit a new all-time high with 1,819 projects with 243,100 rooms.

Market Data | May 1, 2020
Nonresidential construction spending declines in March as pandemic halts projects
Group warns loan threats are hurting relief program.

Market Data | May 1, 2020
6 must reads for the AEC industry today: May 1, 2020
DLR Group completes LA Memorial Coliseum renovation and over 50% of department stores in malls predicted to close by 2021.

Market Data | Apr 30, 2020
5 must reads for the AEC industry today: April 30, 2020
College programs help prepare students for careers in the construction industry and a national movement to cancel May rent takes shape.

Market Data | Apr 30, 2020
The U.S. Hotel Construction pipeline continued to expand year-over-year despite COVID-19 in the first quarter of 2020
Many open or temporarily closed hotels have already begun or are in the planning stages of renovating and repositioning their assets while occupancy is low or non-existent.
Market Data | Apr 29, 2020
5 must reads for the AEC industry today: April 29, 2020
A new Human performance Center and Construction employment declines in 99 metro areas.

Market Data | Apr 29, 2020
Construction employment declines in 99 metro areas in March from 2019
Industry officials call for new state and federal funding to add jobs.

Market Data | Apr 28, 2020
5 must reads for the AEC industry today: April 28, 2020
A virtual 'city-forest' to help solve population density challenges and planning for life in cities after the pandemic.

Market Data | Apr 27, 2020
5 must reads for the AEC industry today: April 27, 2020
Colleges begin building campus eSports arenas and PCL Construction rolls out portable coronavirus testing centers.

Market Data | Apr 24, 2020
6 must reads for the AEC industry today: April 24, 2020
Take a virtual tour of Frank Lloyd Wright's Robie House and Construction Contractor Confidence plummets.


