


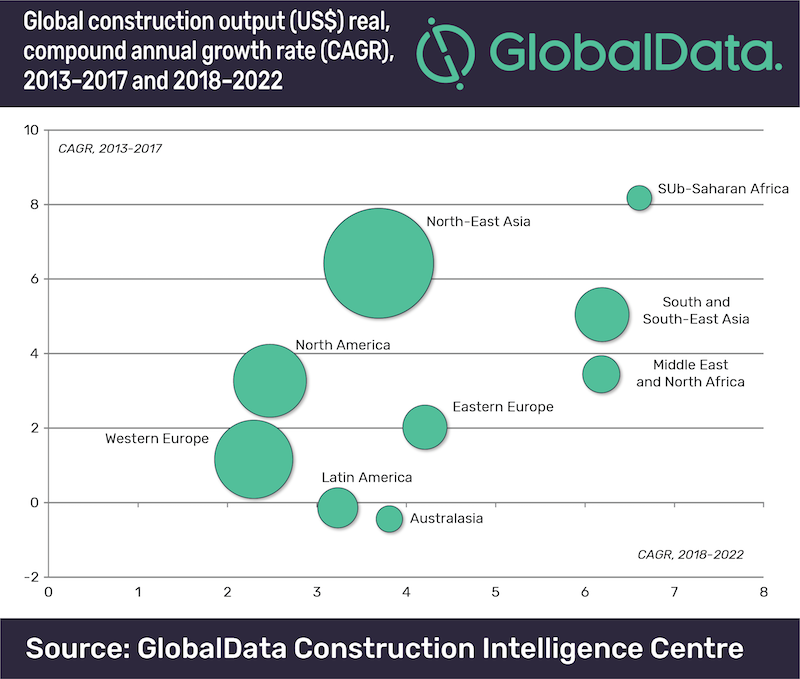
The global construction industry is expected to grow by an average of 3.6% a year over the forecast period 2018 to 2022, according to GlobalData, a data and analytics company.
The company’s latest report, ‘Global Construction Outlook to 2022: Q3 2018 Update’ reveals that in real value terms*, global construction output is forecast to rise to $12.9 trillion by 2022, up from $10.8 trillion in 2017.
Danny Richards, Construction Lead Analyist at GlobalData, says, ‘‘We forecast that global construction output growth will accelerate to +3.6% in 2018, up from 3.1% in 2017, reflecting the recovery in the US as well as general improvements across emerging markets. In South and South-East Asia, for example, construction in India has regained growth momentum, while the pick-up in oil prices has supported the recovery in the Middle East and Africa.’’
The pace of global construction growth is set to improve slightly to 3.7% between 2019 and 2020, before easing back in the latter part of the forecast period, reflecting trends in some of the largest markets.
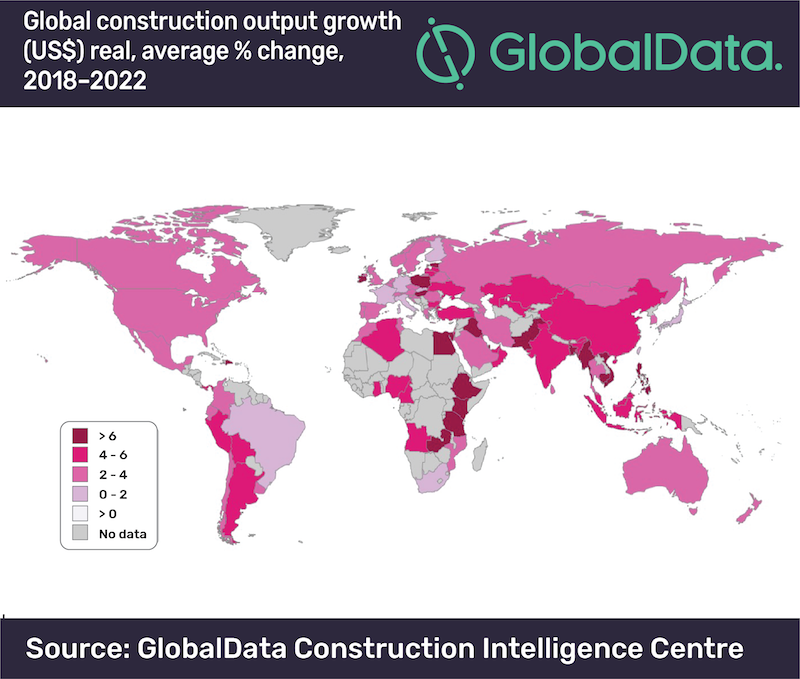
The Asia-Pacific region will continue to account for the largest share of the global construction industry, however the pace of growth will slow given the projected slowdown in China’s construction industry to an average of +4.2% between 2018 and 2022, offset by an acceleration in construction growth in India.
Construction activity is gathering momentum across Western Europe with the region’s output set to expand by 2.4% a year on average from 2018 to 2022. However, expansion in the UK is subject to major downside risks in the face of uncertainty over Brexit.
The Middle East and Africa region as a whole will be the fastest with an annual average growth of 6.4% from 2018 to 2022. Countries in the Gulf Cooperation Council (GCC) have suffered from the weakness in oil prices in recent years, greatly reducing government revenues. As oil prices pick up, however, large-scale investment in infrastructure projects - mostly related to transport - will be a key driving force behind the construction growth in the region.
Richards says, “Whilst there are intensifying downside risks for global construction related to global economic growth, notably stemming from the erupting trade war between the US and China, the global economy will continue to expand in the range of 2.5% to 3% a year from 2018 to 2022 which will support continued construction growth in key markets.’’
* ‘real value terms’ is measured from constant 2017 prices and US$ exchange rates
Related Stories

Market Data | Mar 14, 2019
Construction input prices rise for first time since October
Of the 11 construction subcategories, seven experienced price declines for the month.

Market Data | Mar 6, 2019
Global hotel construction pipeline hits record high at 2018 year-end
There are a record-high 6,352 hotel projects and 1.17 million rooms currently under construction worldwide.

Market Data | Feb 28, 2019
U.S. economic growth softens in final quarter of 2018
Year-over-year GDP growth was 3.1%, while average growth for 2018 was 2.9%.

Market Data | Feb 20, 2019
Strong start to 2019 for architecture billings
“The government shutdown affected architecture firms, but doesn’t appear to have created a slowdown in the profession,” said AIA Chief Economist Kermit Baker, Hon. AIA, PhD, in the latest ABI report.

Market Data | Feb 19, 2019
ABC Construction Backlog Indicator steady in Q4 2018
CBI reached a record high of 9.9 months in the second quarter of 2018 and averaged about 9.1 months throughout all four quarters of last year.

Market Data | Feb 14, 2019
U.S. Green Building Council announces top 10 countries and regions for LEED green building
The list ranks countries and regions in terms of cumulative LEED-certified gross square meters as of December 31, 2018.

Market Data | Feb 13, 2019
Increasingly tech-enabled construction industry powers forward despite volatility
Construction industry momentum to carry through first half of 2019.

Market Data | Feb 4, 2019
U.S. Green Building Council announces annual Top 10 States for LEED Green Building in 2018
Illinois takes the top spot as USGBC defines the next generation of green building with LEED v4.1.

Market Data | Feb 4, 2019
Nonresidential construction spending dips in November
Total nonresidential spending stood at $751.5 billion on a seasonally adjusted annualized rate.

Market Data | Feb 1, 2019
The year-end U.S. hotel construction pipeline continues steady growth trend
Project counts in the early planning stage continue to rise reaching an all-time high of 1,723 projects/199,326 rooms.


