


The global construction industry is expected to grow by an average of 3.6% a year over the forecast period 2018 to 2022, according to GlobalData, a data and analytics company.
The company’s latest report, ‘Global Construction Outlook to 2022: Q3 2018 Update’ reveals that in real value terms*, global construction output is forecast to rise to $12.9 trillion by 2022, up from $10.8 trillion in 2017.
Danny Richards, Construction Lead Analyist at GlobalData, says, ‘‘We forecast that global construction output growth will accelerate to +3.6% in 2018, up from 3.1% in 2017, reflecting the recovery in the US as well as general improvements across emerging markets. In South and South-East Asia, for example, construction in India has regained growth momentum, while the pick-up in oil prices has supported the recovery in the Middle East and Africa.’’
The pace of global construction growth is set to improve slightly to 3.7% between 2019 and 2020, before easing back in the latter part of the forecast period, reflecting trends in some of the largest markets.
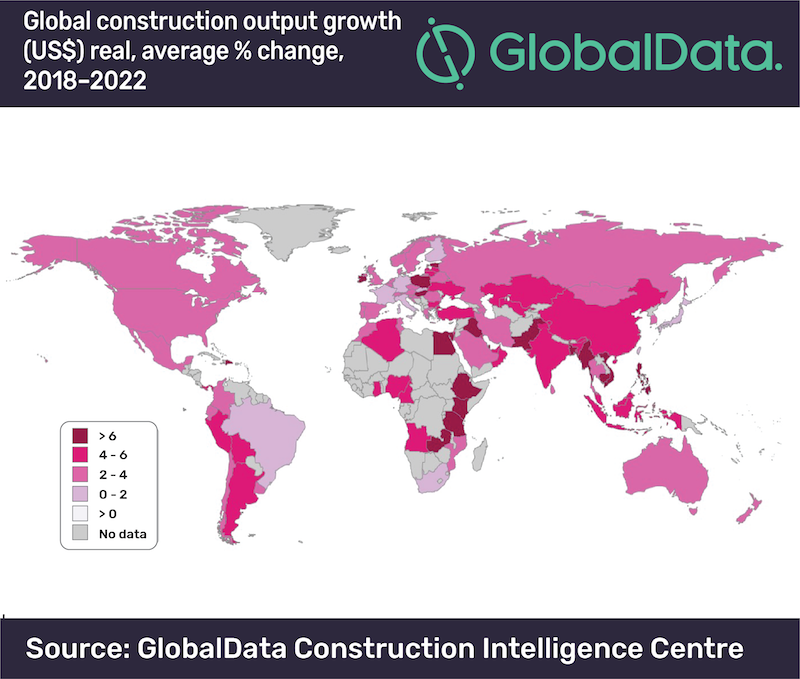
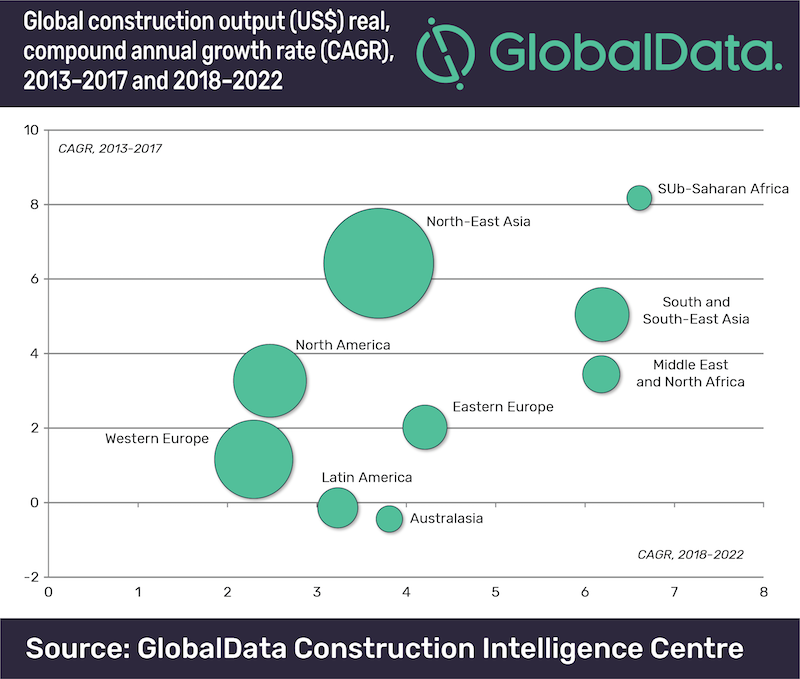
The Asia-Pacific region will continue to account for the largest share of the global construction industry, however the pace of growth will slow given the projected slowdown in China’s construction industry to an average of +4.2% between 2018 and 2022, offset by an acceleration in construction growth in India.
Construction activity is gathering momentum across Western Europe with the region’s output set to expand by 2.4% a year on average from 2018 to 2022. However, expansion in the UK is subject to major downside risks in the face of uncertainty over Brexit.
The Middle East and Africa region as a whole will be the fastest with an annual average growth of 6.4% from 2018 to 2022. Countries in the Gulf Cooperation Council (GCC) have suffered from the weakness in oil prices in recent years, greatly reducing government revenues. As oil prices pick up, however, large-scale investment in infrastructure projects - mostly related to transport - will be a key driving force behind the construction growth in the region.
Richards says, “Whilst there are intensifying downside risks for global construction related to global economic growth, notably stemming from the erupting trade war between the US and China, the global economy will continue to expand in the range of 2.5% to 3% a year from 2018 to 2022 which will support continued construction growth in key markets.’’
* ‘real value terms’ is measured from constant 2017 prices and US$ exchange rates
Related Stories

Market Data | Jul 17, 2019
Design services demand stalled in June
Project inquiry gains hit a 10-year low.

Market Data | Jul 16, 2019
ABC’s Construction Backlog Indicator increases modestly in May
The Construction Backlog Indicator expanded to 8.9 months in May 2019.

K-12 Schools | Jul 15, 2019
Summer assignments: 2019 K-12 school construction costs
Using RSMeans data from Gordian, here are the most recent costs per square foot for K-12 school buildings in 10 cities across the U.S.

Market Data | Jul 12, 2019
Construction input prices plummet in June
This is the first time in nearly three years that input prices have fallen on a year-over-year basis.

Market Data | Jul 1, 2019
Nonresidential construction spending slips modestly in May
Among the 16 nonresidential construction spending categories tracked by the Census Bureau, five experienced increases in monthly spending.

Market Data | Jul 1, 2019
Almost 60% of the U.S. construction project pipeline value is concentrated in 10 major states
With a total of 1,302 projects worth $524.6 billion, California has both the largest number and value of projects in the U.S. construction project pipeline.

Market Data | Jun 21, 2019
Architecture billings remain flat
AIA’s Architecture Billings Index (ABI) score for May showed a small increase in design services at 50.2.

Market Data | Jun 19, 2019
Number of U.S. architects continues to rise
New data from NCARB reveals that the number of architects continues to increase.

Market Data | Jun 12, 2019
Construction input prices see slight increase in May
Among the 11 subcategories, six saw prices fall last month, with the largest decreases in natural gas.

Market Data | Jun 3, 2019
Nonresidential construction spending up 6.4% year over year in April
Among the 16 sectors tracked by the U.S. Census Bureau, nine experienced an increase in monthly spending, led by water supply and highway and street.


