


Most construction disputes are settled before they erupt into migraine-inducing litigation. But global asset volatility, currency turbulence, and the loss of economic momentum globally, have made dispute resolution tougher to reach amicably. And, in fact, for the third consecutive year, the length of disputes rose in 2015, according to a new report by Arcadis, the international design and consultancy firm, based on an in-depth review of projects that the firm’s Contract Solutions team handled last year.
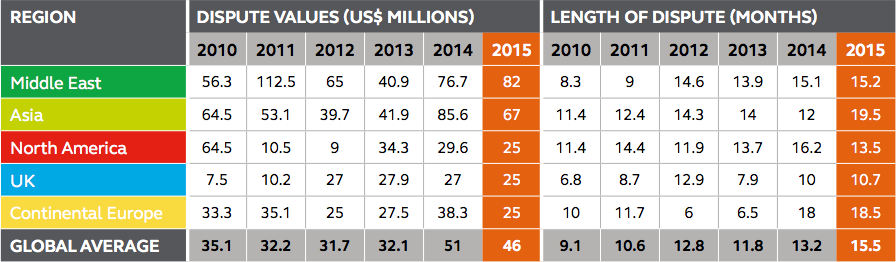
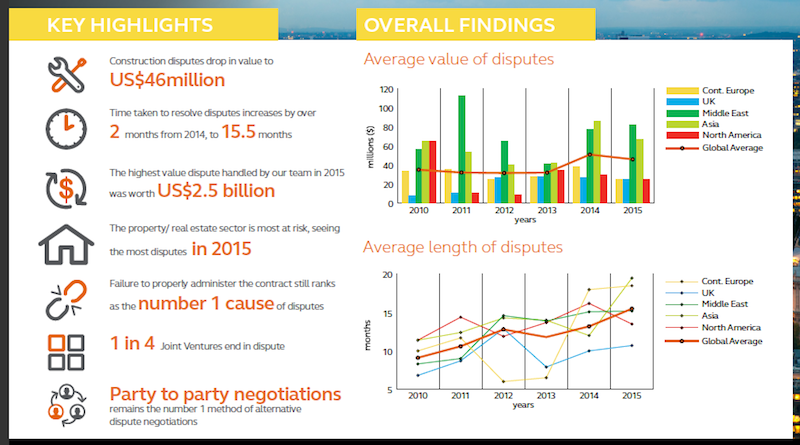
Arcadis, which is active in 70 countries, defines a dispute as a “situation where two parties typically differ in the assertion of a contractual right.” Last year, the value of disputes fell by nearly 11% to an average of $46 million. However, the length of time it took to resolve these conflicts increased to a record average of 15.2 months, compared to 13.2 months in 2014 and 11.8 months in 2013.
The highest value dispute that Arcadis handled last year was worth a whopping $2.5 billion. (The firm did not state where that dispute arose.)
 Contractual disputes took longer to mediate for the third consecutive year in 2015. The No. 1 cause for disputes continues to be faulty contract administration. Image: Arcadis “Global Construction Dispute Report 2016.”
“The increased length of disputes will have multiple effects for both parties and are likely to, ultimately, have a negative impact on the construction industry,” Arcadis cautions in its report.
The No. 1 cause for disputes was failure to properly administer a contract, followed by a poorly written draft and unsubstantiated claims. The property/real estate sector had the most disputes, followed by the social infrastructure/public sector. Arcadis notes, ruefully, that more than one-quarter of joint ventures end in disputes.
Party-to-party negotiation is still the most common form of resolving disputes. And the best ways to avoid disputes in the first place is to make sure the contract is administered properly, the documents are accurate, and the contract has fair and appropriate risk and balances.
While the number of disputes in North America was up last year, their average values and lengths dipped. The value of disputes last year averaged $25 million, a 15.5% drop from the previous year. And the length of disputes in North America was down by nearly three months, to an average of 13.5 months compared to 16.2 in 2014.
Arcadis notes that the U.S. was the only global region to achieve both a decrease in construction dispute values and length of time to resolve disputes last year. “But there is one downside,” notes Roy Cooper, a Vice President for Arcadis North America. “Even though more disputes are being settled early, the ones that remain grow into complicated, emotional affairs, with large damages at stake. These also take longer to resolve, since U.S. courts hate to try construction cases due to their large volumes of documents and greater complexity.”
In North America, errors and omissions in contracts documents are the most common reasons for disputes.
“We expect that the decline in duration and value will continue into 2016 as the industry [in North America] continues to recognize the importance of addressing disputes early in their lifecycle, and contracts are written with provisions giving strict instruction on how and when to address disputes,” writes Arcadis.
Conversely, the Middle East now surpasses Asia as Dispute Central when it comes to contractual disagreements. The average dispute value in that region jumped by 6.9% last year to $82 million, and the length of disputes rose marginally to an average of 15.2 months.
Disputes drag out even longer in Continental Europe, which averaged 18.5 months last year. “Conflicting party interests” was cited by Arcadis as the No. 1 cause for disputes.
Joint ventures are most vulnerable to contract disputes. And the Middle East far exceeds global averages in the value and lenght of its construction disputes. Image: Arcadis “Global Construction Dispute Report 2016.”
Related Stories

Market Data | Dec 19, 2018
When it comes to economic clout, New York will far outpace other U.S. metros for decades to come
But San Jose, Calif., is expected to have the best annual growth rate through 2035, according to Oxford Economics’ latest Global Cities report.

Market Data | Dec 19, 2018
Run of positive billings continues at architecture firms
November marked the fourteenth consecutive month of increasing demand for architectural firm services.

Market Data | Dec 5, 2018
ABC predicts construction sector will remain strong in 2019
Job growth, high backlog and healthy infrastructure investment all spell good news for the industry.

Market Data | Dec 4, 2018
Nonresidential spending rises modestly in October
Thirteen out of 16 subsectors are associated with year-over-year increases.

Market Data | Nov 20, 2018
Construction employment rises from October 2017 to October 2018 in 44 states and D.C.
Texas has biggest annual job increase while New Jersey continues losses; Iowa, Florida and California have largest one-month gains as Mississippi and Louisiana trail.

Market Data | Nov 15, 2018
Architecture firm billings continue to slow, but remain positive in October
Southern region reports decline in billings for the first time since June 2012.

Market Data | Nov 14, 2018
A new Joint Center report finds aging Americans less prepared to afford housing
The study foresees a significant segment of seniors struggling to buy or rent on their own or with other people.

Market Data | Nov 12, 2018
Leading hotel markets in the U.S. construction pipeline
Projects already under construction and those scheduled to start construction in the next 12 months, combined, have a total of 3,782 projects/213,798 rooms and are at cyclical highs.

Market Data | Nov 6, 2018
Unflagging national office market enjoys economic tailwinds
Stable vacancy helped push asking rents 4% higher in third quarter.

Market Data | Nov 2, 2018
Nonresidential spending retains momentum in September, up 8.9% year over year
Total nonresidential spending stood at $767.1 billion on a seasonally adjusted, annualized rate in September.


