


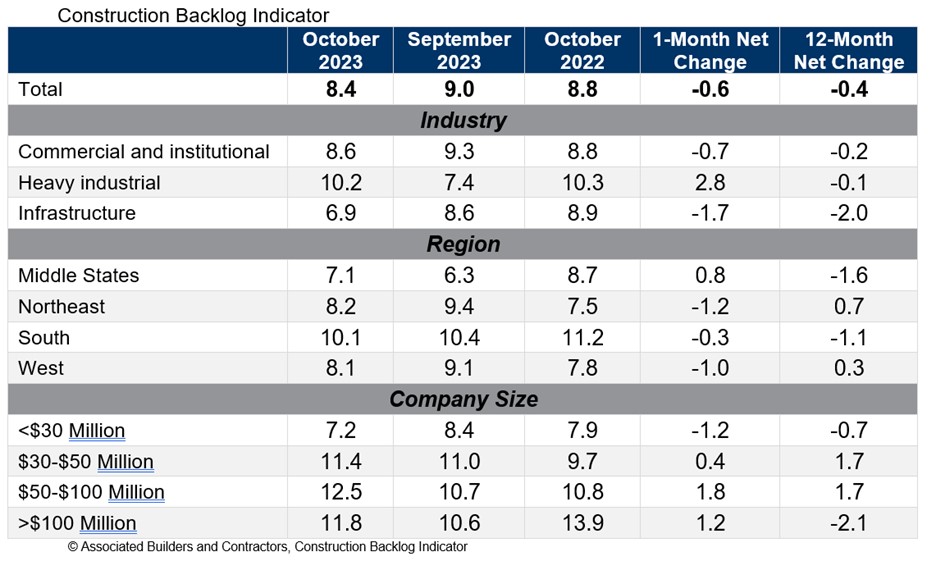
Associated Builders and Contractors reported that its Construction Backlog Indicator declined to 8.4 months in October from 9.0 months in September, according to an ABC member survey conducted from Oct. 19 to Nov. 2. The reading is down 0.4 months from October 2022.
Backlog now stands at its lowest level since the first quarter of 2022. Declines were concentrated among the smallest contractors, those with less than $30 million in annual revenues. All three other revenue categories experienced an increase in backlog in October.
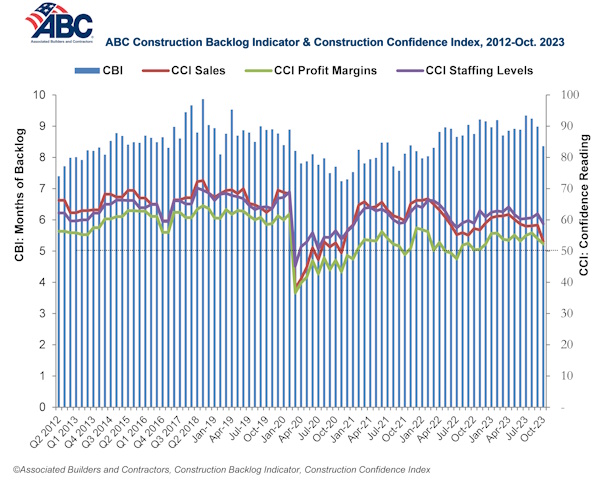
ABC’s Construction Confidence Index readings for sales, staffing levels and profit margins fell in October. All three readings remain above the threshold of 50, indicating expectations for growth over the next six months.
“While larger contractors continue to disproportionately benefit from a bevy of megaprojects around the nation, many smaller contractors are feeling the sting of weaker economic fundamentals in struggling commercial real estate segments,” said ABC Chief Economist Anirban Basu. “Smaller contractors are often the ones most dependent on developer-driven activity. With developers facing both higher borrowing costs and greater difficulty lining up project financing, backlog among some contractors is beginning to dissipate.
“This is precisely what ABC economists predicted,” said Basu. “The vast majority of contractors could boast healthy backlog, especially those working in the manufacturing/industrial, infrastructure, data center and health care segments. But those tied to the office, shopping center and multifamily markets are likely experiencing difficulty lining up work. This helps explain declines in the readings for ABC’s Construction Confidence Index in all three dimensions: sales, employment and margins. Each of these readings, however, remains above 50, suggesting that, while industry growth is softening, it has yet to enter contractionary territory.”
Related Stories

Market Data | May 23, 2018
Architecture firm billings strengthen in April
Firms report solid growth for seven straight months.

Market Data | May 22, 2018
Vacancies stable, rents rising, and pipeline receding, according to Transwestern’s 1Q US Office Market report
The Big Apple still leads the new construction charge.

Market Data | May 18, 2018
Construction employment rises in 38 states and D.C. from April 2017 to April 2018
California & West Virginia have biggest annual job gains, North Dakota has largest decline; California & Louisiana have largest monthly pickup, Indiana & North Dakota lead monthly drops.

High-rise Construction | May 18, 2018
The 100 tallest buildings ever conventionally demolished
The list comes from a recent CTBUH study.

Resiliency | May 17, 2018
Architects brief lawmakers and policy-makers on disaster recovery as hurricane season approaches
Urge senate passage of disaster recovery reform act; Relationship-building with local communities.

Market Data | May 17, 2018
These 25 cities have the highest urban infill development potential
The results stem from a COMMERCIALCafé study.

Market Data | May 10, 2018
Construction costs surge in April as new tariffs and other trade measures lead to significant increases in materials prices
Association officials warn that the new tariffs and resulting price spikes have the potential to undermine benefits of tax and regulatory reform, urge administration to reconsider.

Market Data | May 7, 2018
Construction employers add 17,000 jobs in April and 257,000 for the year
Unemployment rate for construction increases slightly compared to year earlier as higher pay levels appears to be attracting people with recent construction experience back into the workforce.

Market Data | May 2, 2018
Construction employment increases in 245 metro areas between March 2017 & 2018, as trade fights & infrastructure funding shortfalls loom
Houston-The Woodlands-Sugar Land, Texas and Weirton-Steubenville, W.Va.-Ohio experience largest year-over-year gains; Baton Rouge, La. and Auburn-Opelika, Ala. have biggest annual declines.

Market Data | May 2, 2018
Nonresidential Construction down in March, private sector falters, public sector unchanged
February’s spending estimate was revised roughly $10 billion higher.


