


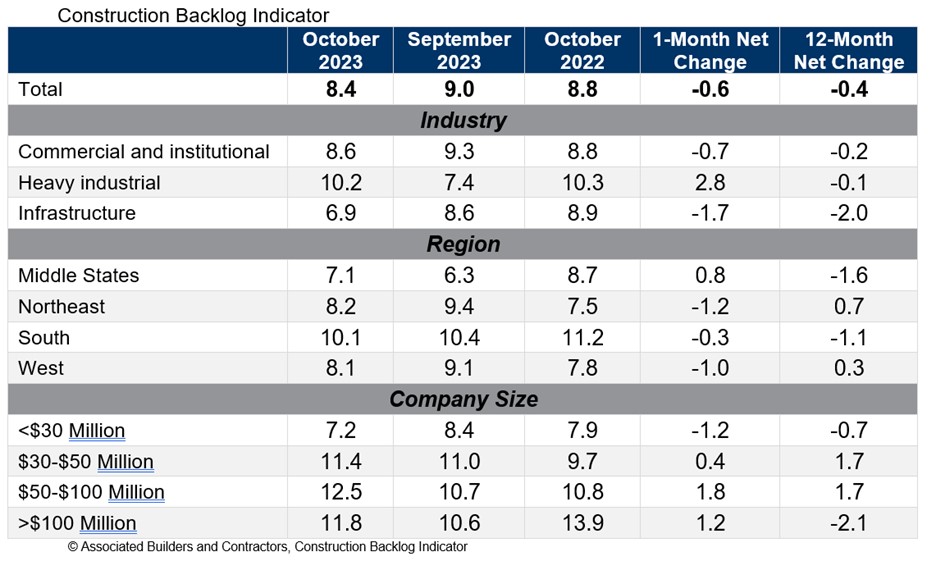
Associated Builders and Contractors reported that its Construction Backlog Indicator declined to 8.4 months in October from 9.0 months in September, according to an ABC member survey conducted from Oct. 19 to Nov. 2. The reading is down 0.4 months from October 2022.
Backlog now stands at its lowest level since the first quarter of 2022. Declines were concentrated among the smallest contractors, those with less than $30 million in annual revenues. All three other revenue categories experienced an increase in backlog in October.
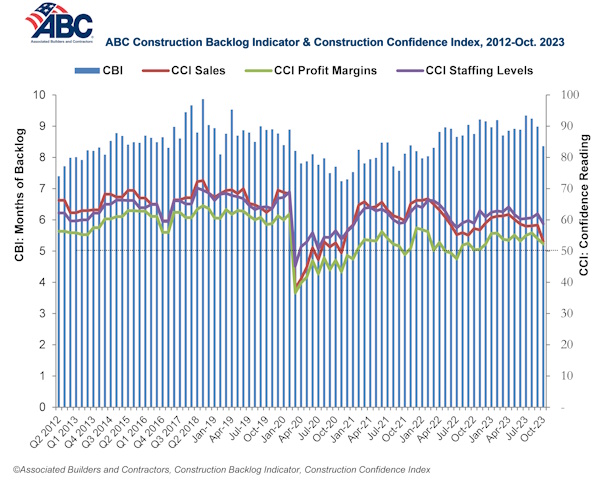
ABC’s Construction Confidence Index readings for sales, staffing levels and profit margins fell in October. All three readings remain above the threshold of 50, indicating expectations for growth over the next six months.
“While larger contractors continue to disproportionately benefit from a bevy of megaprojects around the nation, many smaller contractors are feeling the sting of weaker economic fundamentals in struggling commercial real estate segments,” said ABC Chief Economist Anirban Basu. “Smaller contractors are often the ones most dependent on developer-driven activity. With developers facing both higher borrowing costs and greater difficulty lining up project financing, backlog among some contractors is beginning to dissipate.
“This is precisely what ABC economists predicted,” said Basu. “The vast majority of contractors could boast healthy backlog, especially those working in the manufacturing/industrial, infrastructure, data center and health care segments. But those tied to the office, shopping center and multifamily markets are likely experiencing difficulty lining up work. This helps explain declines in the readings for ABC’s Construction Confidence Index in all three dimensions: sales, employment and margins. Each of these readings, however, remains above 50, suggesting that, while industry growth is softening, it has yet to enter contractionary territory.”
Related Stories

Market Data | Jan 24, 2022
U.S. hotel construction pipeline stands at 4,814 projects/581,953 rooms at year-end 2021
Projects scheduled to start construction in the next 12 months stand at 1,821 projects/210,890 rooms at the end of the fourth quarter.

Market Data | Jan 19, 2022
Architecture firms end 2021 on a strong note
December’s Architectural Billings Index (ABI) score of 52.0 was an increase from 51.0 in November.

Market Data | Jan 13, 2022
Materials prices soar 20% in 2021 despite moderating in December
Most contractors in association survey list costs as top concern in 2022.

Market Data | Jan 12, 2022
Construction firms forsee growing demand for most types of projects
Seventy-four percent of firms plan to hire in 2022 despite supply-chain and labor challenges.

Market Data | Jan 7, 2022
Construction adds 22,000 jobs in December
Jobless rate falls to 5% as ongoing nonresidential recovery offsets rare dip in residential total.

Market Data | Jan 6, 2022
Inflation tempers optimism about construction in North America
Rider Levett Bucknall’s latest report cites labor shortages and supply chain snags among causes for cost increases.

Market Data | Jan 6, 2022
A new survey offers a snapshot of New York’s construction market
Anchin’s poll of 20 AEC clients finds a “growing optimism,” but also multiple pressure points.

Market Data | Jan 3, 2022
Construction spending in November increases from October and year ago
Construction spending in November totaled $1.63 trillion at a seasonally adjusted annual rate.

Market Data | Dec 22, 2021
Two out of three metro areas add construction jobs from November 2020 to November 2021
Construction employment increased in 237 or 66% of 358 metro areas over the last 12 months.

Market Data | Dec 17, 2021
Construction jobs exceed pre-pandemic level in 18 states and D.C.
Firms struggle to find qualified workers to keep up with demand.


