


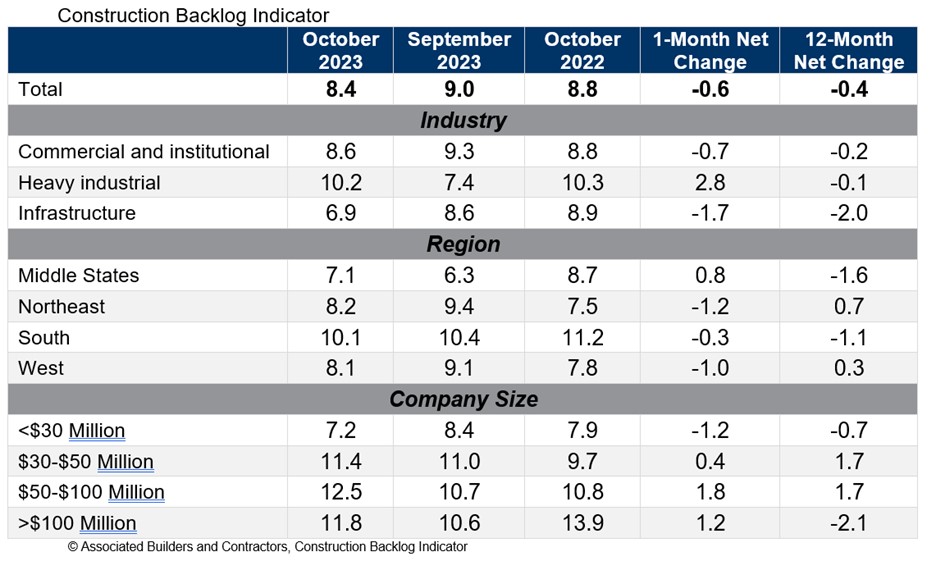
Associated Builders and Contractors reported that its Construction Backlog Indicator declined to 8.4 months in October from 9.0 months in September, according to an ABC member survey conducted from Oct. 19 to Nov. 2. The reading is down 0.4 months from October 2022.
Backlog now stands at its lowest level since the first quarter of 2022. Declines were concentrated among the smallest contractors, those with less than $30 million in annual revenues. All three other revenue categories experienced an increase in backlog in October.
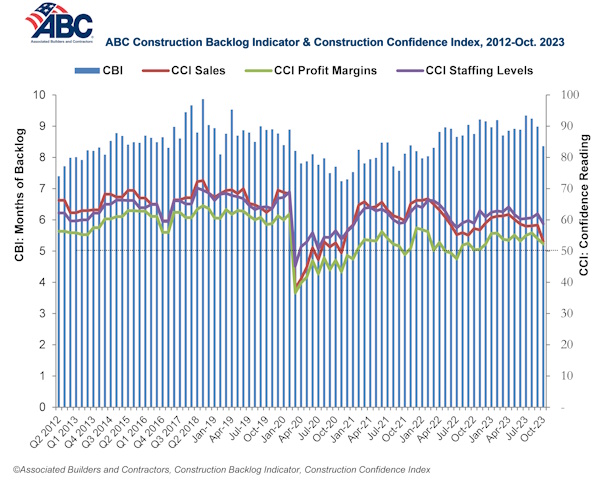
ABC’s Construction Confidence Index readings for sales, staffing levels and profit margins fell in October. All three readings remain above the threshold of 50, indicating expectations for growth over the next six months.
“While larger contractors continue to disproportionately benefit from a bevy of megaprojects around the nation, many smaller contractors are feeling the sting of weaker economic fundamentals in struggling commercial real estate segments,” said ABC Chief Economist Anirban Basu. “Smaller contractors are often the ones most dependent on developer-driven activity. With developers facing both higher borrowing costs and greater difficulty lining up project financing, backlog among some contractors is beginning to dissipate.
“This is precisely what ABC economists predicted,” said Basu. “The vast majority of contractors could boast healthy backlog, especially those working in the manufacturing/industrial, infrastructure, data center and health care segments. But those tied to the office, shopping center and multifamily markets are likely experiencing difficulty lining up work. This helps explain declines in the readings for ABC’s Construction Confidence Index in all three dimensions: sales, employment and margins. Each of these readings, however, remains above 50, suggesting that, while industry growth is softening, it has yet to enter contractionary territory.”
Related Stories

Codes and Standards | Feb 24, 2022
Most owners adapting digital workflows on projects
Owners are more deeply engaged with digital workflows than other project team members, according to a new report released by Trimble and Dodge Data & Analytics.

Market Data | Feb 23, 2022
2022 Architecture Billings Index indicates growth
The Architectural Billings Index measures the general sentiment of U.S. architecture firms about the health of the construction market by measuring 1) design billings and 2) design contracts. Any score above 50 means that, among the architecture firms surveyed, more firms than not reported seeing increases in design work vs. the previous month.

Market Data | Feb 15, 2022
Materials prices soar 20% between January 2021 and January 2022
Contractors' bid prices accelerate but continue to lag cost increases.

Market Data | Feb 4, 2022
Construction employment dips in January despite record rise in wages, falling unemployment
The quest for workers intensifies among industries.

Market Data | Feb 2, 2022
Majority of metro areas added construction jobs in 2021
Soaring job openings indicate that labor shortages are only getting worse.

Market Data | Feb 2, 2022
Construction spending increased in December for the month and the year
Nonresidential and public construction lagged residential sector.

Market Data | Jan 31, 2022
Canada's hotel construction pipeline ends 2021 with 262 projects and 35,325 rooms
At the close of 2021, projects under construction stand at 62 projects/8,100 rooms.

Market Data | Jan 27, 2022
Record high counts for franchise companies in the early planning stage at the end of Q4'21
Through year-end 2021, Marriott, Hilton, and IHG branded hotels represented 585 new hotel openings with 73,415 rooms.

Market Data | Jan 27, 2022
Dallas leads as the top market by project count in the U.S. hotel construction pipeline at year-end 2021
The market with the greatest number of projects already in the ground, at the end of the fourth quarter, is New York with 90 projects/14,513 rooms.

Market Data | Jan 26, 2022
2022 construction forecast: Healthcare, retail, industrial sectors to lead ‘healthy rebound’ for nonresidential construction
A panel of construction industry economists forecasts 5.4 percent growth for the nonresidential building sector in 2022, and a 6.1 percent bump in 2023.


