


The Architecture Billings Index (ABI), produced by the AIA Economics & Market Research Group, is a leading economic indicator that provides an approximately nine- to twelve-month glimpse into the future of nonresidential construction spending activity. The diffusion indexes contained in the full report are derived from a monthly “work-on-the-boards” survey that is sent to a panel of AIA member-owned firms.
Participants are asked whether their billings increased, decreased, or stayed the same in the month that just ended as compared to the prior month, and the results are then compiled into the ABI. These monthly results are also seasonally adjusted to allow for comparison to prior months. The monthly ABI index scores are centered around 50, with scores above 50 indicating an aggregate increase in billings, and scores below 50 indicating a decline.
Following a generally positive performance in 2015, the Architecture Billings Index has begun this year modestly dipping back into negative terrain. The AIA reported the January ABI score was 49.6, down slightly from the mark of 51.3 in the previous month. This score reflects a minor decrease in design services (any score above 50 indicates an increase in billings). The new projects inquiry index was 55.3, down from a reading of 60.5 the previous month.
“The fundamentals are mostly sound in the nonresidential design and construction market,” said AIA Chief Economist, Kermit Baker, Hon. AIA, PhD. “January was a rocky month throughout the economy, with falling oil prices, international economic concerns, and with steep declines in stock market valuations in the U.S. and elsewhere. Some of the fallout of this uncertainty may have affected progress on design projects.”
Key January* ABI highlights:
- Regional averages: West (50.8), Northeast (50.4), South (50.3), Midwest (48.9),
- Sector index breakdown: multifamily residential (51.9), commercial / industrial (50.5), institutional (49.9), mixed practice (49.0)
- Project inquiries index: 55.3
- Design contracts index: 50.9
The regional and sector categories are calculated as a 3-month moving average, whereas the national index, design contracts and inquiries are monthly numbers.
* Every January the AIA research department updates the seasonal factors used to calculate the ABI, resulting in a revision of recent ABI values.
Related Stories

Market Data | Apr 30, 2020
The U.S. Hotel Construction pipeline continued to expand year-over-year despite COVID-19 in the first quarter of 2020
Many open or temporarily closed hotels have already begun or are in the planning stages of renovating and repositioning their assets while occupancy is low or non-existent.
Market Data | Apr 29, 2020
5 must reads for the AEC industry today: April 29, 2020
A new Human performance Center and Construction employment declines in 99 metro areas.

Market Data | Apr 29, 2020
Construction employment declines in 99 metro areas in March from 2019
Industry officials call for new state and federal funding to add jobs.

Market Data | Apr 28, 2020
5 must reads for the AEC industry today: April 28, 2020
A virtual 'city-forest' to help solve population density challenges and planning for life in cities after the pandemic.

Market Data | Apr 27, 2020
5 must reads for the AEC industry today: April 27, 2020
Colleges begin building campus eSports arenas and PCL Construction rolls out portable coronavirus testing centers.

Market Data | Apr 24, 2020
6 must reads for the AEC industry today: April 24, 2020
Take a virtual tour of Frank Lloyd Wright's Robie House and Construction Contractor Confidence plummets.

Market Data | Apr 23, 2020
Construction Contractor Confidence plummets in February
As of February 2020, fewer than 30% of contractors expected their sales to increase over the next six months.

Market Data | Apr 23, 2020
5 must reads for the AEC industry today: April 23, 2020
The death of the department store and how to return to work when the time comes.
Market Data | Apr 22, 2020
6 must reads for the AEC industry today: April 22, 2020
Repurposed containers can be used as rapid response airborne infection isolation rooms and virtual site visits help control infection on project sites.
Market Data | Apr 21, 2020
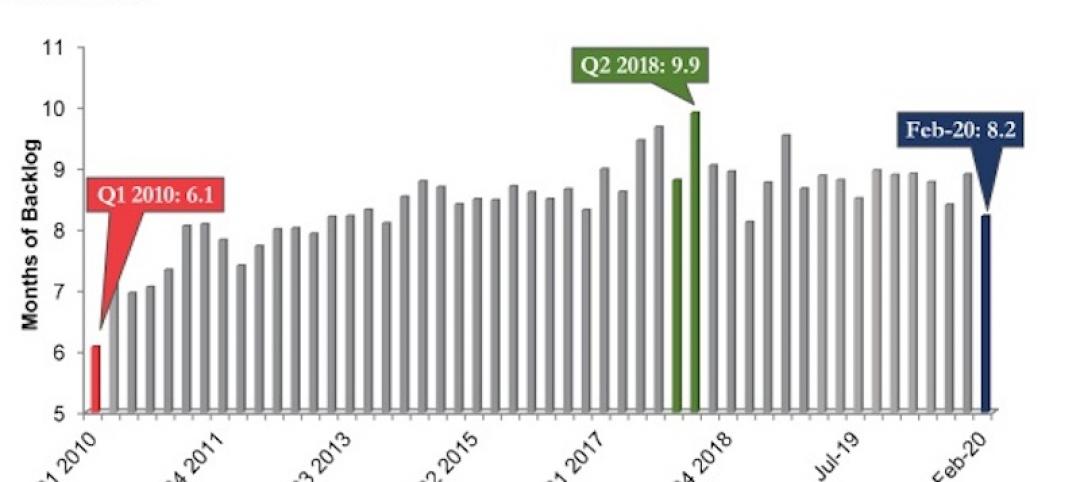
ABC's Construction Backlog Indicator down in February
Backlog for firms working in the infrastructure segment rose by 1.3 months in February while backlog for commercial and institutional and heavy industrial firms declined by 0.6 months and 0.7 months, respectively.


