


The Architecture Billings Index (ABI), produced by the AIA Economics & Market Research Group, is a leading economic indicator that provides an approximately nine- to twelve-month glimpse into the future of nonresidential construction spending activity. The diffusion indexes contained in the full report are derived from a monthly “work-on-the-boards” survey that is sent to a panel of AIA member-owned firms.
Participants are asked whether their billings increased, decreased, or stayed the same in the month that just ended as compared to the prior month, and the results are then compiled into the ABI. These monthly results are also seasonally adjusted to allow for comparison to prior months. The monthly ABI index scores are centered around 50, with scores above 50 indicating an aggregate increase in billings, and scores below 50 indicating a decline.
Following a generally positive performance in 2015, the Architecture Billings Index has begun this year modestly dipping back into negative terrain. The AIA reported the January ABI score was 49.6, down slightly from the mark of 51.3 in the previous month. This score reflects a minor decrease in design services (any score above 50 indicates an increase in billings). The new projects inquiry index was 55.3, down from a reading of 60.5 the previous month.
“The fundamentals are mostly sound in the nonresidential design and construction market,” said AIA Chief Economist, Kermit Baker, Hon. AIA, PhD. “January was a rocky month throughout the economy, with falling oil prices, international economic concerns, and with steep declines in stock market valuations in the U.S. and elsewhere. Some of the fallout of this uncertainty may have affected progress on design projects.”
Key January* ABI highlights:
- Regional averages: West (50.8), Northeast (50.4), South (50.3), Midwest (48.9),
- Sector index breakdown: multifamily residential (51.9), commercial / industrial (50.5), institutional (49.9), mixed practice (49.0)
- Project inquiries index: 55.3
- Design contracts index: 50.9
The regional and sector categories are calculated as a 3-month moving average, whereas the national index, design contracts and inquiries are monthly numbers.
* Every January the AIA research department updates the seasonal factors used to calculate the ABI, resulting in a revision of recent ABI values.
Related Stories
Market Data | May 12, 2020
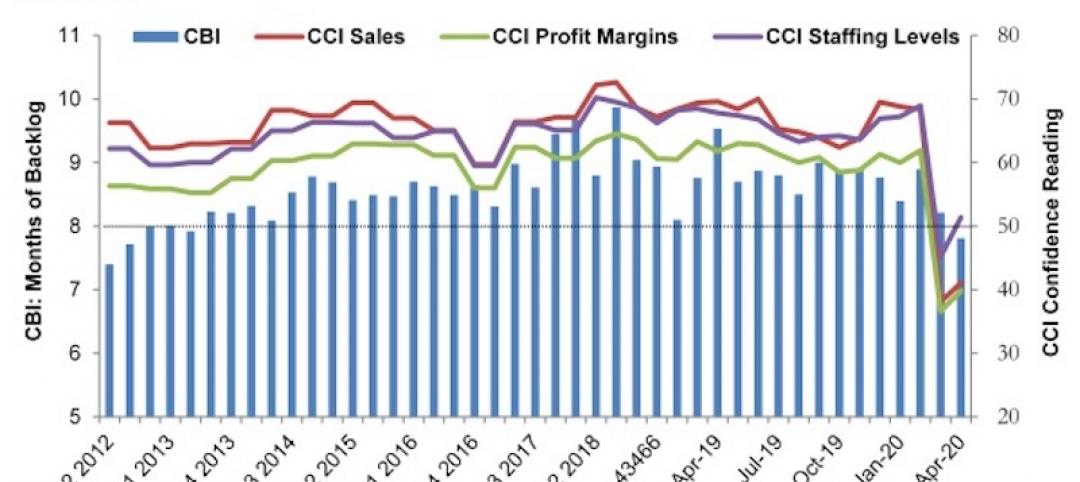
ABC’s Construction Backlog Indicator falls in April; Contractor Confidence rebounds from historic lows
Nonresidential construction backlog is down 0.4 months compared to the March 2020 ABC survey and 1.7 months from April 2019.

Market Data | May 12, 2020
6 must reads for the AEC industry today: May 12, 2020
A 13-point plan to reduce coronavirus deaths in nursing homes and Bjarke Ingels discusses building on Mars.

Market Data | May 11, 2020
Interest in eSports is booming amid COVID-19
The industry has proved largely immune to the COVID-19 pandemic due to its prompt transition into online formats and sudden spike in interest from traditional sports organizations.

Market Data | May 11, 2020
6 must reads for the AEC industry today: May 11, 2020
Nashville residential tower will rise 416 feet and the construction industry loses 975,000 jobs.

Market Data | May 8, 2020
Construction industry loses 975,000 jobs in April as new association survey shows deteriorating demand for construction projects
Association partner Procore also releases near real-time construction data measuring impacts of coronavirus as association calls for new measures.

Market Data | May 8, 2020
7 must reads for the AEC industry today: May 8, 2020
The death of the office and Colorado's first multifamily project to receive WELL Precertification.

Market Data | May 7, 2020
5 must reads for the AEC industry today: May 7, 2020
5 memory care communities with a strong sense of mission and making jobsites safer in the COVID-19 world.

Market Data | May 6, 2020
6 must reads for the AEC industry today: May 6, 2020
5 questions engineers will ask after COVID-19 and coronavirus threatens push for denser housing.

Market Data | May 5, 2020
5 must reads for the AEC industry today: May 5, 2020
A new temporary hospital pops up in N.J., and apartment firms' reactivation plans begin to take shape.

Market Data | May 4, 2020
6 must reads for the AEC industry today: May 4, 2020
How working from home is influencing design and is this the end of the open office?


