


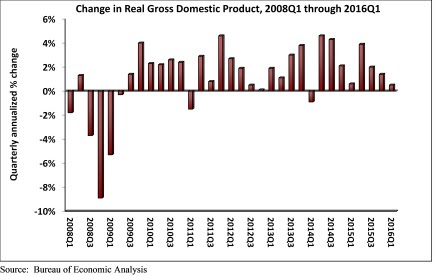
Real gross domestic product (GDP) expanded only 0.5% on a seasonally adjusted annual rate during 2016's first quarter according to an analysis of Bureau of Economic Analysis data released today by Associated Builders and Contractors (ABC). This disappointing figure follows a 1.4% annualized rate of economic output expansion during the fourth quarter of 2015.
Nonresidential fixed investment struggled with a 5.9% decline during the year's first three months after falling 2.1% during 2015's final quarter. Nonresidential fixed investment in structures fared particularly poorly, declining 10.7% during the first quarter on an annualized basis while nonresidential investment in equipment fell 8.6%.
"Aside from consumer spending growth, state and local government spending growth and residential building, very little expanded in America during the first three months of 2016," said ABC Chief Economist Anirban Basu. "It is quite conceivable that the current U.S. economic expansion will end before the economy registers a 3% or better rate of growth for a single calendar year. The last time the U.S. economy expanded more than 3% was in 2005, when the economy expanded 3.4%."
"Corporate profitability has been slipping in recent quarters and the mergers and acquisition marketplace has heated up, an unfavorable sign for nonresidential contractors," said Basu. "Many corporate CEOs continue to use available cash to purchase competitors either to gain access to product pipelines, thereby diminishing required product development expenses, or to generate cost savings by eliminating duplicative functions. The result is a lack of business investment generally and a slowing pace of private nonresidential construction spending growth. If it not for an enormous amount of foreign money coming to our shores, private nonresidential construction growth would have been even softer in early 2016. While falling energy-related investment and seasonal factors represent important parts of the story, there are indications of a broader malaise."
The following segments highlight the first quarter GDP release:
- Personal consumption expenditures rose 1.9% on an annualized basis during the first quarter of 2016 after growing 2.4% during the fourth quarter of 2015.
- Spending on goods inched 0.1% higher during the first quarter after expanding by 1.6% during the fourth quarter.
- Real final sales of domestically produced output increased 0.9% in the first quarter after rising 1.6% in the fourth.
- Federal government spending fell by 1.6% in the year's first quarter after expanding 2.3% in the fourth quarter of 2015.
- Nondefense spending increased by 1.5% in both the first quarter of 2016 and the fourth quarter of 2015.
- National defense spending fell by 3.6% in the fourth quarter after registering a 2.8% increase in the previous quarter.
- State and local government spending increased by 2.9% in the first quarter after falling 1.2% during the prior quarter.
Related Stories

Market Data | Aug 10, 2020
5 must reads for the AEC industry today: August 10, 2020
Private student housing owners reap the benefits as campus housing de-densifies and race for COVID vaccine boosts real estate in life sciences hubs.

Market Data | Aug 7, 2020
6 must reads for the AEC industry today: August 7, 2020
BD+C's 2020 Color Trends Report and HMC releases COVID-19 Campus Reboot Guide for Prek-12 schools.

Market Data | Aug 6, 2020
6 must reads for the AEC industry today: August 6, 2020
Oklahoma State's new North Academic Building and can smart buildings outsmart coronavirus?

Market Data | Aug 5, 2020
6 must reads for the AEC industry today: August 5, 2020
San Jose's new tallest tower and Virginia is the first state to adopt COVID-19 worker safety rules.

Market Data | Aug 4, 2020
7 must reads for the AEC industry today: August 4, 2020
Construction spending decreases for fourth consecutive month and 100% affordable housing development breaks ground in Mountain View.
Market Data | Aug 3, 2020
Construction spending decreases for fourth consecutive month in June
Association officials warn further contraction is likely unless federal government enacts prompt, major investment in infrastructure as state and local governments face deficits.

Market Data | Aug 3, 2020
6 must reads for the AEC industry today: August 3, 2020
The future is a number game for retail and restaurants and 5 reasons universities are renovating student housing.

Market Data | Jul 31, 2020
5 must reads for the AEC industry today: July 31, 2020
Vegas's newest resort and casino is packed with contactless technology and Mariott, Hilton, and IHG dominate the U.S. hotel construction pipeline.

Market Data | Jul 30, 2020
Marriott, Hilton, and IHG continue to dominate the U.S. hotel construction pipeline at Q2’20 close
Hilton’s Home2 Suites and IHG’s Holiday Inn Express continue to be the most prominent brands in the U.S. pipeline.

Market Data | Jul 30, 2020
7 must reads for the AEC industry today: July 30, 2020
Millennium Tower finally has a fix and construction costs decrease for the first time in 10 years.


