


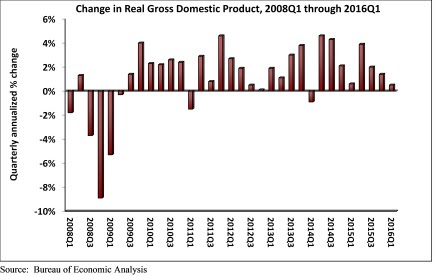
Real gross domestic product (GDP) expanded only 0.5% on a seasonally adjusted annual rate during 2016's first quarter according to an analysis of Bureau of Economic Analysis data released today by Associated Builders and Contractors (ABC). This disappointing figure follows a 1.4% annualized rate of economic output expansion during the fourth quarter of 2015.
Nonresidential fixed investment struggled with a 5.9% decline during the year's first three months after falling 2.1% during 2015's final quarter. Nonresidential fixed investment in structures fared particularly poorly, declining 10.7% during the first quarter on an annualized basis while nonresidential investment in equipment fell 8.6%.
"Aside from consumer spending growth, state and local government spending growth and residential building, very little expanded in America during the first three months of 2016," said ABC Chief Economist Anirban Basu. "It is quite conceivable that the current U.S. economic expansion will end before the economy registers a 3% or better rate of growth for a single calendar year. The last time the U.S. economy expanded more than 3% was in 2005, when the economy expanded 3.4%."
"Corporate profitability has been slipping in recent quarters and the mergers and acquisition marketplace has heated up, an unfavorable sign for nonresidential contractors," said Basu. "Many corporate CEOs continue to use available cash to purchase competitors either to gain access to product pipelines, thereby diminishing required product development expenses, or to generate cost savings by eliminating duplicative functions. The result is a lack of business investment generally and a slowing pace of private nonresidential construction spending growth. If it not for an enormous amount of foreign money coming to our shores, private nonresidential construction growth would have been even softer in early 2016. While falling energy-related investment and seasonal factors represent important parts of the story, there are indications of a broader malaise."
The following segments highlight the first quarter GDP release:
- Personal consumption expenditures rose 1.9% on an annualized basis during the first quarter of 2016 after growing 2.4% during the fourth quarter of 2015.
- Spending on goods inched 0.1% higher during the first quarter after expanding by 1.6% during the fourth quarter.
- Real final sales of domestically produced output increased 0.9% in the first quarter after rising 1.6% in the fourth.
- Federal government spending fell by 1.6% in the year's first quarter after expanding 2.3% in the fourth quarter of 2015.
- Nondefense spending increased by 1.5% in both the first quarter of 2016 and the fourth quarter of 2015.
- National defense spending fell by 3.6% in the fourth quarter after registering a 2.8% increase in the previous quarter.
- State and local government spending increased by 2.9% in the first quarter after falling 1.2% during the prior quarter.
Related Stories

Market Data | Sep 29, 2020
6 must reads for the AEC industry today: September 29, 2020
Renovation to Providence's downtown library is completed and Amazon to build 1,500 new last-mile warehouses.

Market Data | Sep 25, 2020
5 must reads for the AEC industry today: September 25, 2020
AIA releases latest 2030 Commitment results and news delivery robots could generate trillions for U.S. economy.

Market Data | Sep 24, 2020
6 must reads for the AEC industry today: September 24, 2020
SOM's new waterfront neighborhood and a portable restroom designed for mobility.

Market Data | Sep 23, 2020
Architectural billings in August still show little sign of improvement
The pace of decline during August remained at about the same level as in July and June.

Market Data | Sep 23, 2020
7 must reads for the AEC industry today: September 23, 2020
The new Theodore Presidential Library and the AIA/HUD's Secretary's Awards honor affordable, accessible housing.

Market Data | Sep 22, 2020
6 must reads for the AEC industry today: September 22, 2020
Construction employment declined in 39 states and no ease of lumber prices in sight.

Market Data | Sep 21, 2020
Washington is the US state with the most value of construction projects underway, says GlobalData
Of the top 10 largest projects in the Washington state, nine were in the execution stage as of August 2020.

Market Data | Sep 21, 2020
Construction employment declined in 39 states between August 2019 and 2020
31 states and DC added jobs between July and August.

Market Data | Sep 21, 2020
6 must reads for the AEC industry today: September 21, 2020
Four projects receive 202 AIA/ALA Library Building Award and Port San Antonio's new Innovation Center.

Market Data | Sep 18, 2020
Follow up survey of U.S. code officials demonstrates importance of continued investment in virtual capabilities
Existing needs highlight why supporting building and fire prevention departments at the federal, state, and local levels is critical.


