


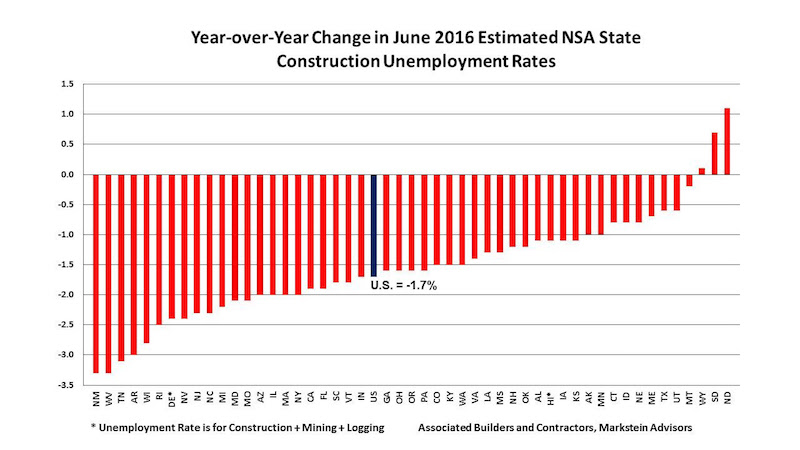
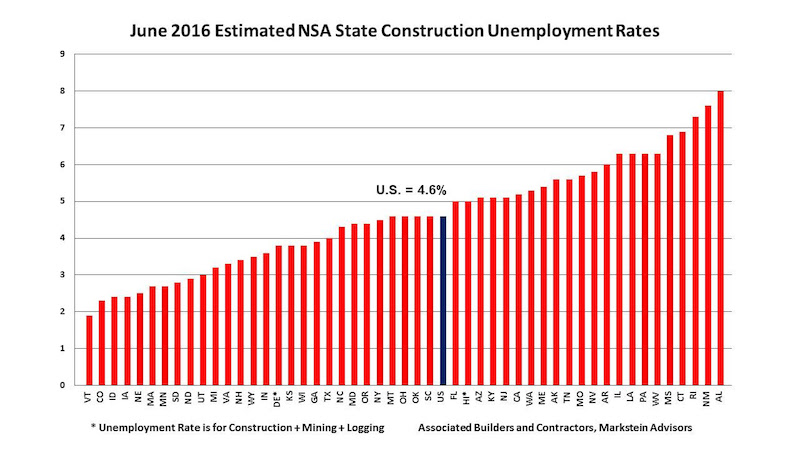
June not seasonally adjusted (NSA) construction unemployment rates improved in 47 states and the nation on a year-over-year basis according to analysis released today by Associated Builders and Contractors (ABC). The national construction unemployment rate of 4.6 percent was 1.7 percent lower than a year ago according to data from the Bureau of Labor Statistics (BLS). Further, the industry boasted its lowest June rate since 2000 when it matched this June’s 4.6 percent rate. BLS data also showed that the industry employed 229,000 more people than in June 2015.
“Starting in 2000, when the BLS data for this series begins, the June national NSA construction unemployment rate has fallen from May every year except 2010 when it was unchanged. This is not surprising given that this is not seasonally adjusted data and that construction activity normally continues to rise nationwide as the weather improves throughout the country. This year’s decrease of 0.6 percent from May continues this pattern,” says economist Bernard M. Markstein, Ph.D., President and Chief Economist of Markstein Advisors, who conducted the analysis for ABC.
The five states with the lowest estimated NSA construction unemployment rates in order from lowest rate to highest were:
1. Vermont
2. Colorado
3. Idaho and Iowa (tie)
5. Nebraska
Three states—Iowa, Nebraska and Vermont—were also among the top five in May.
The five states with the highest estimated NSA construction unemployment rates (from lowest to highest) were:
46. Mississippi
47. Connecticut
48. Rhode Island
49. New Mexico
50. Alabama
Alabama, New Mexico and Rhode Island were also in the bottom five in May.
View states ranked by their construction unemployment rate, their year-over-year improvement in construction employment and monthly improvement in construction employment.
Read more on ABC's website.
Related Stories

Industry Research | Aug 11, 2017
NCARB releases latest data on architectural education, licensure, and diversity
On average, becoming an architect takes 12.5 years—from the time a student enrolls in school to the moment they receive a license.

Market Data | Aug 4, 2017
U.S. grand total construction starts growth projection revised slightly downward
ConstructConnect’s quarterly report shows courthouses and sports stadiums to end 2017 with a flourish.

Market Data | Aug 2, 2017
Nonresidential Construction Spending falls in June, driven by public sector
June’s weak construction spending report can be largely attributed to the public sector.

Market Data | Jul 31, 2017
U.S. economic growth accelerates in second quarter; Nonresidential fixed investment maintains momentum
Nonresidential fixed investment, a category of GDP embodying nonresidential construction activity, expanded at a 5.2% seasonally adjusted annual rate.

Multifamily Housing | Jul 27, 2017
Game rooms and game simulators popular amenities in multifamily developments
The number of developments providing space for physical therapy was somewhat surprising, according to a new survey.

Architects | Jul 25, 2017
AIA 2030 Commitment expands beyond 400 architecture firms
The 2016 Progress Report is now available.

Market Data | Jul 25, 2017
Moderating economic growth triggers construction forecast downgrade for 2017 and 2018
Prospects for the construction industry have weakened with developments over the first half of the year.

Industry Research | Jul 6, 2017
The four types of strategic real estate amenities
From swimming pools to pirate ships, amenities (even crazy ones) aren’t just perks, but assets to enhance performance.
Market Data | Jun 29, 2017
Silicon Valley, Long Island among the priciest places for office fitouts
Coming out on top as the most expensive market to build out an office is Silicon Valley, Calif., with an out-of-pocket cost of $199.22.

Industry Research | Jun 27, 2017
What does the client really want?
In order to deliver superior outcomes to our healthcare clients, we have to know what our clients want.


