


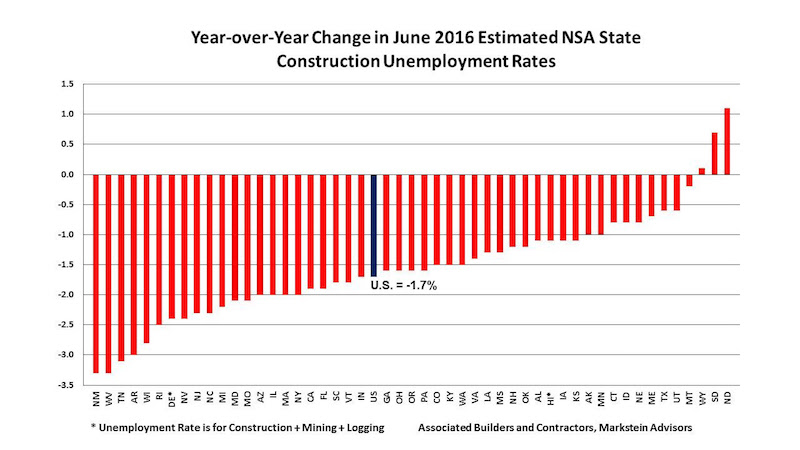
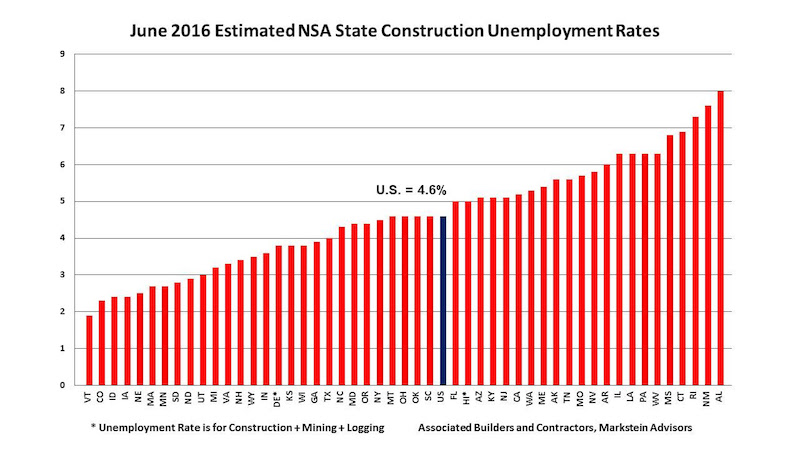
June not seasonally adjusted (NSA) construction unemployment rates improved in 47 states and the nation on a year-over-year basis according to analysis released today by Associated Builders and Contractors (ABC). The national construction unemployment rate of 4.6 percent was 1.7 percent lower than a year ago according to data from the Bureau of Labor Statistics (BLS). Further, the industry boasted its lowest June rate since 2000 when it matched this June’s 4.6 percent rate. BLS data also showed that the industry employed 229,000 more people than in June 2015.
“Starting in 2000, when the BLS data for this series begins, the June national NSA construction unemployment rate has fallen from May every year except 2010 when it was unchanged. This is not surprising given that this is not seasonally adjusted data and that construction activity normally continues to rise nationwide as the weather improves throughout the country. This year’s decrease of 0.6 percent from May continues this pattern,” says economist Bernard M. Markstein, Ph.D., President and Chief Economist of Markstein Advisors, who conducted the analysis for ABC.
The five states with the lowest estimated NSA construction unemployment rates in order from lowest rate to highest were:
1. Vermont
2. Colorado
3. Idaho and Iowa (tie)
5. Nebraska
Three states—Iowa, Nebraska and Vermont—were also among the top five in May.
The five states with the highest estimated NSA construction unemployment rates (from lowest to highest) were:
46. Mississippi
47. Connecticut
48. Rhode Island
49. New Mexico
50. Alabama
Alabama, New Mexico and Rhode Island were also in the bottom five in May.
View states ranked by their construction unemployment rate, their year-over-year improvement in construction employment and monthly improvement in construction employment.
Read more on ABC's website.
Related Stories

Industry Research | Aug 29, 2019
Construction firms expect labor shortages to worsen over the next year
A new AGC-Autodesk survey finds more companies turning to technology to support their jobsites.

Codes and Standards | Aug 29, 2019
Industry leaders ask for government help as trades shortage worsens
AGC asks for more funding for education and increased immigration to fill gaps.

Multifamily Housing | Aug 19, 2019
Top 10 outdoor amenities in multifamily housing for 2019
Top 10 results in the “Outdoor Amenities” category in our Multifamily Design+Construction Amenities Survey 2019.

Multifamily Housing | Aug 12, 2019
Multifamily Amenities 2019: Rethinking the $30,000 cup of coffee
What amenities are “must-have” rather than “nice to have” for the local market? Which amenities will attract the renters or buyers you’re targeting? The 2019 Multifamily Amenities Survey measured 113 amenity choices.

Codes and Standards | Jun 27, 2019
Public restrooms being used for changing clothes, phone conversations, and 'getting away'
About 60% of Americans use a public restroom one to five times a week, according to the latest annual hand washing survey conducted by Bradley Corporation.

Industry Research | Jun 11, 2019
New research suggests individual work spaces increase productivity
The research was conducted by Perkins Eastman and Three H.

Industry Research | Apr 8, 2019
New research finds benefits to hiring architectural services based on qualifications
Government agencies gain by evaluating beyond price, according to a new Dodge survey of government officials.

Office Buildings | Jul 17, 2018
Transwestern report: Office buildings near transit earn 65% higher lease rates
Analysis of 15 major metros shows the average rent in central business districts was $43.48/sf for transit-accessible buildings versus $26.01/sf for car-dependent buildings.

Market Data | May 29, 2018
America’s fastest-growing cities: San Antonio, Phoenix lead population growth
San Antonio added 24,208 people between July 2016 and July 2017, according to U.S. Census Bureau data.

Industry Research | Jan 30, 2018
AIA’s Kermit Baker: Five signs of an impending upturn in construction spending
Tax reform implications and rebuilding from natural disasters are among the reasons AIA’s Chief Economist is optimistic for 2018 and 2019.


