


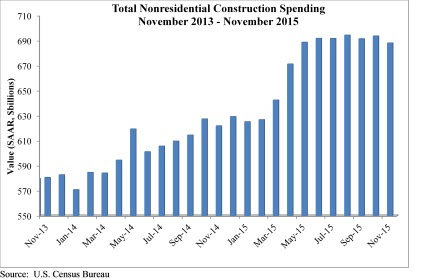
Spending for nonresidential construction, which had been on the uptick for most of 2015, stumbled in the latter months.
Related Stories

Contractors | Sep 12, 2023
The average U.S. contractor has 9.2 months worth of construction work in the pipeline, as of August 2023
Associated Builders and Contractors' Construction Backlog Indicator declined to 9.2 months in August, down 0.1 month, according to an ABC member survey conducted from Aug. 21 to Sept. 6. The reading is 0.5 months above the August 2022 level.

Contractors | Sep 11, 2023
Construction industry skills shortage is contributing to project delays
Relatively few candidates looking for work in the construction industry have the necessary skills to do the job well, according to a survey of construction industry managers by the Associated General Contractors of America (AGC) and Autodesk.
Market Data | Sep 6, 2023
Far slower construction activity forecast in JLL’s Midyear update
The good news is that market data indicate total construction costs are leveling off.

Giants 400 | Sep 5, 2023
Top 80 Construction Management Firms for 2023
Alfa Tech, CBRE Group, Skyline Construction, Hill International, and JLL top the rankings of the nation's largest construction management (as agent) and program/project management firms for nonresidential buildings and multifamily housing work, as reported in Building Design+Construction's 2023 Giants 400 Report.

Giants 400 | Sep 5, 2023
Top 150 Contractors for 2023
Turner Construction, STO Building Group, DPR Construction, Whiting-Turner Contracting Co., and Clark Group head the ranking of the nation's largest general contractors, CM at risk firms, and design-builders for nonresidential buildings and multifamily buildings work, as reported in Building Design+Construction's 2023 Giants 400 Report.

Market Data | Sep 5, 2023
Nonresidential construction spending increased 0.1% in July 2023
National nonresidential construction spending grew 0.1% in July, according to an Associated Builders and Contractors analysis of data published today by the U.S. Census Bureau. On a seasonally adjusted annualized basis, nonresidential spending totaled $1.08 trillion and is up 16.5% year over year.

Giants 400 | Aug 31, 2023
Top 35 Engineering Architecture Firms for 2023
Jacobs, AECOM, Alfa Tech, Burns & McDonnell, and Ramboll top the rankings of the nation's largest engineering architecture (EA) firms for nonresidential buildings and multifamily buildings work, as reported in Building Design+Construction's 2023 Giants 400 Report.

Giants 400 | Aug 22, 2023
Top 115 Architecture Engineering Firms for 2023
Stantec, HDR, Page, HOK, and Arcadis North America top the rankings of the nation's largest architecture engineering (AE) firms for nonresidential building and multifamily housing work, as reported in Building Design+Construction's 2023 Giants 400 Report.

Giants 400 | Aug 22, 2023
2023 Giants 400 Report: Ranking the nation's largest architecture, engineering, and construction firms
A record 552 AEC firms submitted data for BD+C's 2023 Giants 400 Report. The final report includes 137 rankings across 25 building sectors and specialty categories.

Giants 400 | Aug 22, 2023
Top 175 Architecture Firms for 2023
Gensler, HKS, Perkins&Will, Corgan, and Perkins Eastman top the rankings of the nation's largest architecture firms for nonresidential building and multifamily housing work, as reported in Building Design+Construction's 2023 Giants 400 Report.


