

Staying ahead of cost trends can feel like an uphill battle. Market volatility, geographical variations and the lag between project initiation to build introduces unpredictability in the total cost of construction projects. Working in uncertainty can lead to budget overruns, delays and decreased profitability, making it challenging to keep up. But what if there was a solution that could turn these challenges into opportunities for success? To ensure success in any project, you need the ability to anticipate changes and make informed decisions.
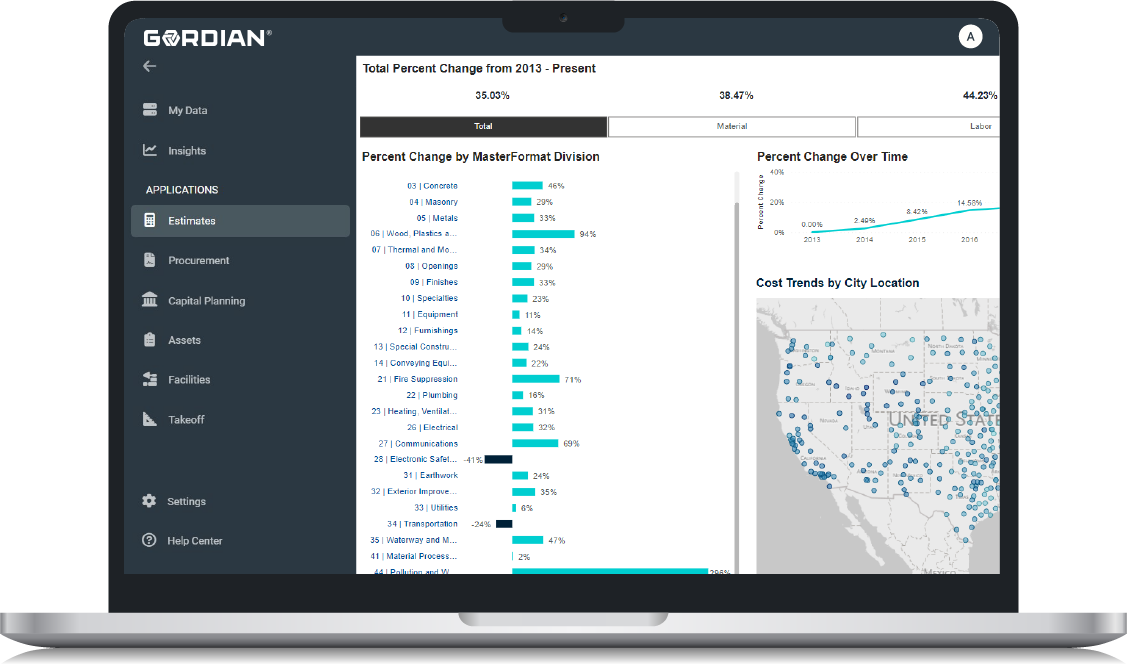
Turn data into actionable intelligence with Gordian’s new Data Insights – Cost Trends Dashboard, powered by RSMeans™ Data. Unveiled at their 2024 RSMeans™ Data Webinar, Gordian’s latest tool empowers organizations to gain more real time insight into shifting cost trends across construction categories and geographies – all within a single, visually digestible dashboard.
Gordian’s Data Insights – Cost Trends gives you a comprehensive view into historical construction cost trends, providing visibility into current cost movements. This allows you to strategically evaluate and adjust your estimates and budgets based on how prices have fluctuated in past, similar market conditions. By using a systematic, automated method of accessing cost trends, you have up-to-date insights at your fingertips, saving time, eliminating guesswork and enhancing decision-making.
What Can You Expect From Data Insights – Cost Trends?
- Go from guesswork to an objective approach
Leveraging past experiences for project budgeting and estimating is beneficial, but manual methods are error-prone and inefficient. A systematic, objective approach allows you to identify hidden patterns, understand trends over time and adjust estimates to align with current market conditions.
- Granular insights across construction categories
Leveraging RSMeans™ Data, the Dashboard provides an aggregated, historical view of cost data in an intuitive design, giving you the ability to compare multiple levels of detail based on empirical figures. From overall cost trends to drilling down by cost components, including labor, material, equipment or at the task division level.
Historical cost trends across geographies
Whether you are looking for local market insights or researching unfamiliar geographical markets, the Dashboard provides location-specific cost trends for nearly 1,000 North American markets so you can compare costs and benchmark across various locations. Uncover hidden patterns in historical cost data, providing a clear picture of trends over time, or pinpoint current market conditions in nearby areas to determine where you can find cost savings on materials and project costs.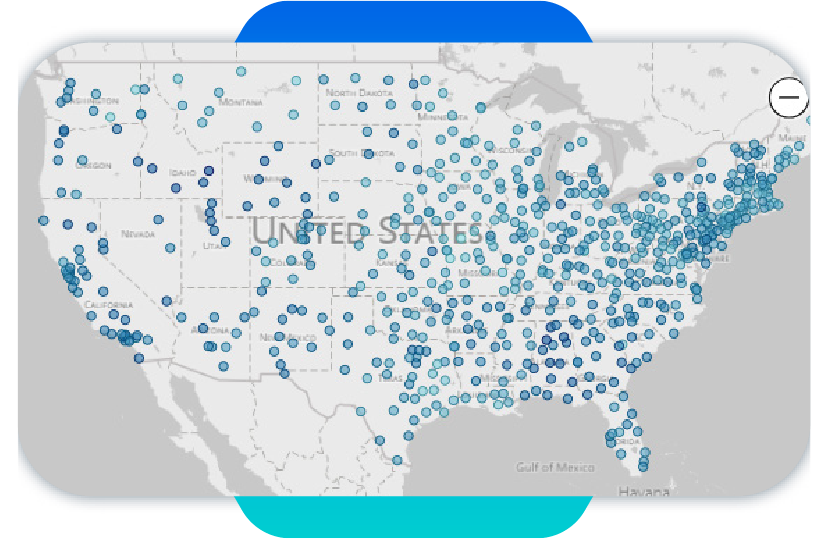
Access local market insights or research unfamiliar geographical markets.
- Communicate data in a way everyone can understand
Complex data insights are made easily digestible through clear visualizations in an intuitive interface. Empower non-technical users to explore and discover actionable market intelligences to anticipate cost changes, adjust budgets and make informed decisions when prioritizing and planning construction projects.
Get Ready to Empower Your Organization With Actionable Intelligence
Gordian’s Data Insights – Cost Trends Dashboard provides more than just data. It offers a flexible, intuitive and interactive experience, enabling more effective planning, budgeting and estimating in construction projects. It’s the tool that empowers estimators, facility owners, facility managers and contractors alike to take control of projects.
Staying ahead of cost trends is no longer a luxury, it’s a necessity. Learn how you can start making informed, proactive decisions to ensure your organizations success with Gordian’s new Data Insights – Cost Trends Dashboard.
Company Information:
Name: Gordian
Website: rsmeans.com
Contact Information: Sales Inquiries – 888-675-3601
Related Stories

Big Data | May 5, 2016
The Center for Neighborhood Technology has launched the largest source of transit data in the country
AllTransit analyzes the social benefits of good transit service by analyzing data related to health, equity, and economic development.

Big Data | May 5, 2016
Demand for data integration technologies for buildings is expected to soar over the next decade
A Navigant Research report takes a deeper dive to examine where demand will be strongest by region and building type.

Big Data | Apr 18, 2016
Chicago to install 500 sensors through its Array of Things data project
The devices will track traffic, light, air quality, and temperatures. The data will be made available to the public.

Big Data | Mar 28, 2016
Predictive analytics: How design firms can benefit from using data to find patterns, trends, and relationships
Branden Collingsworth, HDR’s new Director of Predictive Analytics, clarifies what his team does and how architecture projects can benefit from predictive analytics.


