


The nation is at the beginning stages of a 20-plus year surge in its older population. By 2035, one in five people in the U.S. will be aged 65 and over, up from one in seven today. By that same year, one in three households will be headed by someone aged 65 or older.
Those projections come from a new report published by the Harvard Joint Center of Housing Studies, which examines the challenges that lie ahead for a country where owners and renters are getting older, more diverse, but also more likely to be struggling with physical and mental infirmities that require regular care.
Will the housing sector be up to meeting the demands of an older population, many of whom prefer to age in their current residences? “A wider array of housing types can offer safer, more affordable, and lower-maintenance homes within existing communities,” the report states.
First, some statistics: The Census Bureau estimates the 65-and-over population will increase by more than 30 million people by 2035 and reach 79 million, with more than half that growth occurring in the next decade. The 80-and-over population alone will double between 2015 and 2035 to 24 million, with 70 percent of that growth occurring from 2025-2035.
The Joint Center projects that this population growth will translate into an increase of nearly 20 million older households, from 29.9 million in 2015 to 49.6 million by 2035. The number of owner households headed by a person aged 65 or over will soar from 24 million in 2015 to 32 million by 2025, and then to 38 million by 2035, an overall increase of 62%. Homeowner households headed by someone aged 80 or over will experience particularly steep growth, more than doubling from nearly 6 million to over 12 million within the next 20 years.
Over these two decades, the sheer growth in the older population will mean the number of renter households will expand from 6 million to more than 11 million households. Overall, the share of renters will increase slightly, from 21% of older households in 2015 to 23% in 2035.
Single-person households will grow slightly more quickly among older adults to total roughly 22 million households in 2035, barely outnumbering the 21 million projected married-couple households age 65 and over.
As the population ages, the home is an increasingly important setting for the delivery of long-term care, a trend likely to grow over the next two decades as millions more seek to remain in their current dwellings while coping with disabilities and health challenges.
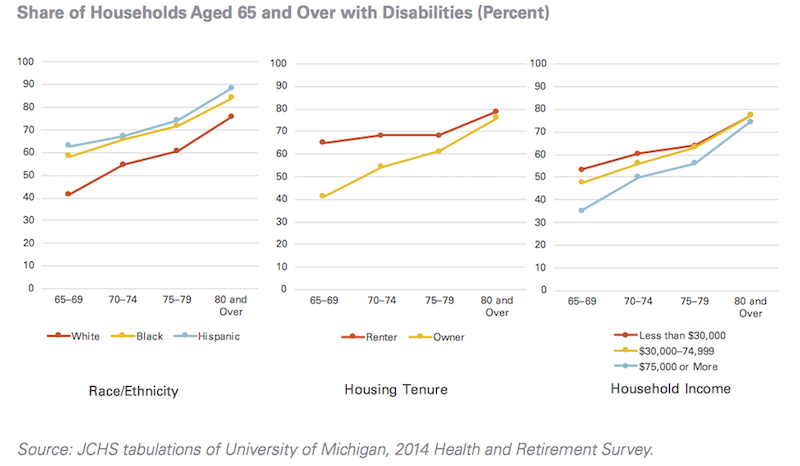 The home will increasingly become a setting for delivery of long-term care in the U.S., where older householders with a disability will grow by 76% to 31.2 milion by 2035. Image: Joint Center for Housing Studies
By 2035, older households with a disability will increase by 76 percent to reach 31.2 million. By that time, 17 million older households will include someone with a mobility disability, 12 million with a self-care disability, and 27 million with a household activity disability. Roughly half the anticipated increase of 13.4 million older households with disabilities will occur by 2025, with the remainder in the 2025-2035 decade.
By 2035, 17 million older adult households will have at least one person with a mobility disability, for whom stairs, narrow corridors and doorways, and traditional bathroom layouts will pose challenges to safety and independence. Over five million of these will be renter households. Renters are more likely than owners to have mobility disabilities, but also have less control over modifying their units.
The conundrum is that only 1 percent of the current housing stock offers the key accessibility features that people with disabilities require. And the financial wherewithal of older Americans to install those features or modify their houses themselves will be limited.
More than nine million older homeowners have less than $50,000 in non-housing assets. “Clearly, costs will pose challenges for many who will need to secure paid help to remain in their homes,” says the Joint Center. Renters’ assets are even more meager.
In the future, more women will be eligible for Social Security. But the Social Security Administration’s MINT (Modeling Incomes in the Near Term) model projects the share of all older adults having the means to maintain their pre-retirement lifestyle after they retire falling from 43% today to 39% in 2035. These trends together suggest a future widening in income distributions among older adults.
Households that pay more than half their income for housing costs are projected to reach 8.6 million by 2035. For both owners and renters, the numbers of severely cost-burdened households aged 80 and over will more than double.
In light of these trends and projections, the Joint Center recommends the following actions to ensure housing that provides adequate quality of life for an aging population:
•Increase accessible housing.
•Assist older owners with housing cost burdens.
•Increase subsidies to older renters.
•Strengthen ties between health care and housing.
•Increase public awareness.
•Expand housing options.
Related Stories

Market Data | Jan 28, 2020
Los Angeles has the largest hotel construction pipeline in the United States
Los Angeles will have a growth rate of 2.5% with 19 new hotels/2,589 rooms opening.

Market Data | Jan 27, 2020
U.S. hotel construction pipeline finishes 2019 trending upward
Projects under construction continue to rise reaching an all-time high of 1,768 projects.

Market Data | Jan 24, 2020
U.S. Green Building Council releases the top 10 states for LEED
Colorado leads the nation, showing how LEED green buildings support climate action and a better quality of life.

Market Data | Jan 23, 2020
Construction contractor confidence surges into 2020, says ABC
Confidence among U.S. construction industry leaders increased in November 2019 with respect to sales, profit margins, and staffing, according to the Associated Builders and Contractors Construction Confidence Index.

Market Data | Jan 22, 2020
Architecture Billings Index ends year on positive note
AIA’s Architecture Billings Index (ABI) score of 52.5 for December reflects an increase in design services provided by U.S. architecture firms.

AEC Tech | Jan 16, 2020
EC firms with a clear ‘digital roadmap’ should excel in 2020
Deloitte, in new report, lays out a risk mitigation strategy that relies on tech.

Market Data | Jan 13, 2020
Construction employment increases by 20,000 in December and 151,000 in 2019
Survey finds optimism about 2020 along with even tighter labor supply as construction unemployment sets record December low.

Market Data | Jan 10, 2020
North America’s office market should enjoy continued expansion in 2020
Brokers and analysts at two major CRE firms observe that tenants are taking longer to make lease decisions.

Market Data | Dec 17, 2019
Architecture Billings Index continues to show modest growth
AIA’s Architecture Billings Index (ABI) score of 51.9 for November reflects an increase in design services provided by U.S. architecture firms.

Market Data | Dec 12, 2019
2019 sets new record for supertall building completion
Overall, the number of completed buildings of at least 200 meters in 2019 declined by 13.7%.


