


The U.S. office market continues to be one of the economy’s growth sectors, based on what the national real estate firm Transwestern gleans from the 48 of its markets that reported first-quarter results.
More than 45% of those markets—22, to be exact—registered improvements in direct vacancy, and 30 recorded increased in direct and sublet vacancy in the first quarter.
Overall, the office market’s vacancy rate, at 9.7% in the latest quarter, remained stable compared to the same period a year ago. And the vacancy rates were considerably lower in some of the country’s hottest real estate markets, such as Seattle (8.2%), Orlando (7.8%), Tampa (7.9%), and San Francisco (8.2%).
San Francisco was also the first-quarter leader in new absorptions, at more than 1.5 million sf, followed by Seattle, Dallas/Fort Worth, and San Jose, which was the leader in trailing four-quarters net absorption (nearly 7 million sf).

San Jose, Charlotte, Manhattan, and San Francisco were among the leading metros in terms of first-quarter office absorption and rent appreciation. Image: Transwestern U.S. Markets | Offices
All told, the U.S. market absorbed 14.1 million sf of office space in the first three months of 2018. That makes 31 consecutive quarters of positive absorption growth, although the absorption rate still lags three- and five-year quarterly averages.
Conversely, 1Q18 represented the fourth straight quarter of declines in new office construction, which stood at 141.1 million sf that period. Manhattan is by far and away the most active office construction market in the country, with nearly 18 million sf in starts in the first quarter. (Manhattan also has 432.9 million sf of office inventory, whose vacancy rate was 9.1%.) The next closest construction market, DFW, had 8.29 million sf in starts. (DFW’s vacancy rate was 16.7% in the first quarter.)
(The average new construction starts for Transwestern’s markets were 2 million sf.)
The number of office employees rose to 36 million, representing a 1.9% annual growth rate.
Transwestern states that the average asking rents continued to climb in the first quarter, marking the 20th consecutive month of increases. Charlotte, N.C., saw the biggest jump in asking rents, to 15.3%, followed by East Bay/Oakland, Calif. (9.5%) and Atlanta (7.7%).
Related Stories

Market Data | Jun 3, 2020
6 must reads for the AEC industry today: June 3, 2020
5 ways to improve cleanliness of public restrooms and office owners are in no hurry for tenants to return.

Market Data | Jun 2, 2020
Architects, health experts release strategies, tools for safely reopening buildings
AIA issues three new and enhanced tools for reducing risk of COVID-19 transmission in buildings.

Market Data | Jun 2, 2020
5 must reads for the AEC industry today: June 2, 2020
New Luxembourg office complex breaks ground and nonresidential construction spending falls.
Market Data | Jun 1, 2020
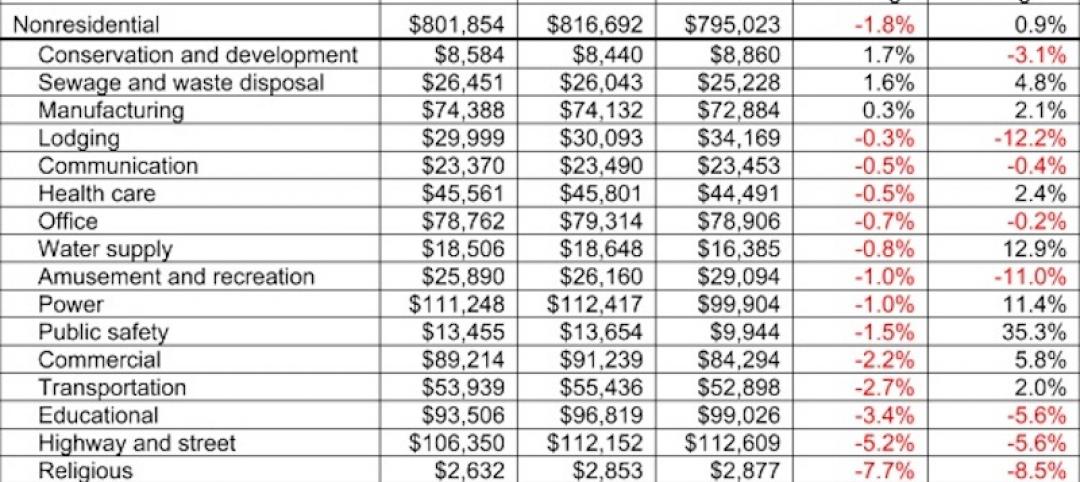
Nonresidential construction spending falls in April
Of the 16 subcategories, 13 were down on a monthly basis.
Market Data | Jun 1, 2020
7 must reads for the AEC industry today: June 1, 2020
Energy storage as an amenity and an entry-point for wellness screening everywhere.

Market Data | May 29, 2020
House-passed bill making needed improvements to paycheck protection program will allow construction firms to save more jobs
Construction official urges senate and White House to quickly pass and sign into law the Paycheck Protection Program Flexibility Act.

Market Data | May 29, 2020
7 must reads for the AEC industry today: May 29, 2020
Using lighting IoT data to inform a safer office reentry strategy and Ghafari joins forces with Eview 360.

Market Data | May 27, 2020
5 must reads for the AEC industry today: May 28, 2020
Biophilic design on the High Line and the office market could be a COVID-19 casualty.

Market Data | May 27, 2020
6 must reads for the AEC industry today: May 27, 2020
AIA's COTE Top Ten Awards and OSHA now requires employers to track COVID-19 cases.

Market Data | May 26, 2020
6 must reads for the AEC industry today: May 26, 2020
Apple's new Austin hotel and is CLT really a green solution?


