


Bolstered by a positive economic environment, U.S. multifamily rents increased 3% year-over-year in January 2020.
Sixteen of the country’s top 30 markets posted year-over-year rent growth above the national average and none experienced a decline, a new report from Yardi® Matrix shows. The $1,463 rent was $1 below the average for December, but “stagnant or decelerating rents are common during the winter months and could continue” through the first quarter, the report says. The national economy’s resilience continues to sustain “strong and steady” multifamily fundamentals.
Phoenix and Las Vegas maintained their year-over-year rent growth leadership for the 16th consecutive month in January. Sacramento, Calif., California’s Inland Empire and Nashville, Tenn., rounded out the top five metros. Nashville and Charlotte, N.C., the No. 6 entry, have benefited from corporate relocations from higher-cost cities. Boston was the lone Northeastern market in the top 10.
Potential impediments to rent growth this year include new statewide rent control measures and increased local regulation of security deposits and resident acceptance criteria.
National supply deliveries figure to decline this year as “multifamily construction originations are at a five-year low and the increased cost of labor and materials continues to be an issue,” according to the report.
Get the latest in-depth data on employment, supply, occupancy and market rent growth trends in the Yardi Matrix multifamily national report for January 2020.
Related Stories

Contractors | Jul 13, 2023
Construction input prices remain unchanged in June, inflation slowing
Construction input prices remained unchanged in June compared to the previous month, according to an Associated Builders and Contractors analysis of U.S. Bureau of Labor Statistics Producer Price Index data released today. Nonresidential construction input prices were also unchanged for the month.

Contractors | Jul 11, 2023
The average U.S. contractor has 8.9 months worth of construction work in the pipeline, as of June 2023
Associated Builders and Contractors reported that its Construction Backlog Indicator remained unchanged at 8.9 months in June 2023, according to an ABC member survey conducted June 20 to July 5. The reading is unchanged from June 2022.

Market Data | Jul 5, 2023
Nonresidential construction spending decreased in May, its first drop in nearly a year
National nonresidential construction spending decreased 0.2% in May, according to an Associated Builders and Contractors analysis of data published today by the U.S. Census Bureau. On a seasonally adjusted annualized basis, nonresidential spending totaled $1.06 trillion.

Apartments | Jun 27, 2023
Average U.S. apartment rent reached all-time high in May, at $1,716
Multifamily rents continued to increase through the first half of 2023, despite challenges for the sector and continuing economic uncertainty. But job growth has remained robust and new households keep forming, creating apartment demand and ongoing rent growth. The average U.S. apartment rent reached an all-time high of $1,716 in May.

Industry Research | Jun 15, 2023
Exurbs and emerging suburbs having fastest population growth, says Cushman & Wakefield
Recently released county and metro-level population growth data by the U.S. Census Bureau shows that the fastest growing areas are found in exurbs and emerging suburbs.

Contractors | Jun 13, 2023
The average U.S. contractor has 8.9 months worth of construction work in the pipeline, as of May 2023
Associated Builders and Contractors reported that its Construction Backlog Indicator remained unchanged at 8.9 months in May, according to an ABC member survey conducted May 20 to June 7. The reading is 0.1 months lower than in May 2022. Backlog in the infrastructure category ticked up again and has now returned to May 2022 levels. On a regional basis, backlog increased in every region but the Northeast.
Industry Research | Jun 13, 2023
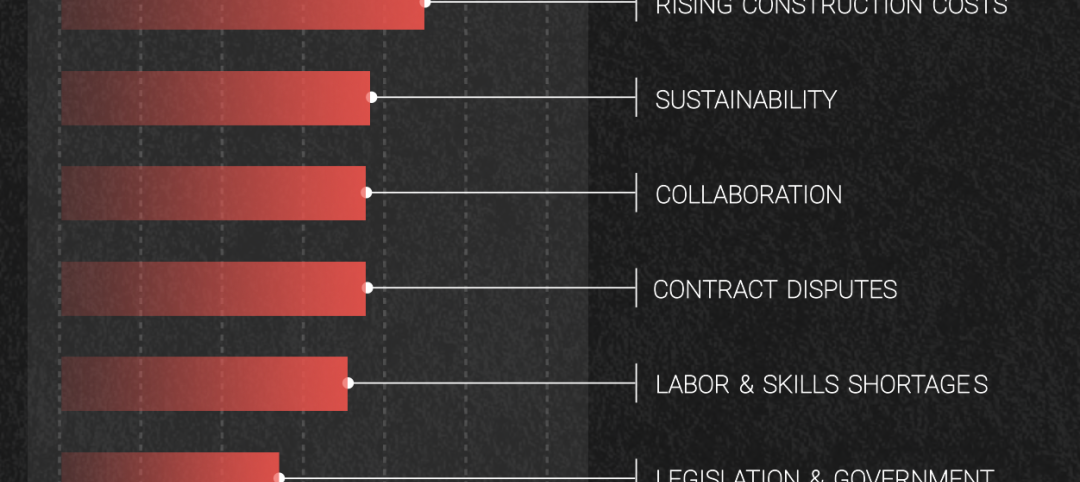
Two new surveys track how the construction industry, in the U.S. and globally, is navigating market disruption and volatility
The surveys, conducted by XYZ Reality and KPMG International, found greater willingness to embrace technology, workplace diversity, and ESG precepts.

| Jun 5, 2023
Communication is the key to AEC firms’ mental health programs and training
The core of recent awareness efforts—and their greatest challenge—is getting workers to come forward and share stories.

Contractors | May 24, 2023
The average U.S. contractor has 8.9 months worth of construction work in the pipeline, as of April 2023
Contractor backlogs climbed slightly in April, from a seven-month low the previous month, according to Associated Builders and Contractors.

Multifamily Housing | May 23, 2023
One out of three office buildings in largest U.S. cities are suitable for residential conversion
Roughly one in three office buildings in the largest U.S. cities are well suited to be converted to multifamily residential properties, according to a study by global real estate firm Avison Young. Some 6,206 buildings across 10 U.S. cities present viable opportunities for conversion to residential use.


