


At the end of the first quarter of 2019, analysts at Lodging Econometrics (LE) reported that the total U.S. construction pipeline continued to expand with 5,647 projects/687,941 rooms, up a strong 7% by projects and 8% by rooms year-over-year (YOY). Pipeline totals are a mere 236 projects, or 4%, shy of the all-time high of 5,883 projects/785,547 rooms reached in the second quarter of 2008. The record should be pierced later in the year. Conversions and renovations are already at record levels.
Projects currently under construction stand at 1,709 projects/227,924 rooms with projects scheduled to start construction in the next 12 months at 2,429 projects/281,395 rooms. Projects in the early planning stage stand at 1,509 projects/178,622 rooms.
The upscale, upper-midscale, and midscale chain scales, all reached record-highs for both projects and rooms. Sixty-six percent of projects in the total pipeline are concentrated in two chain scales: upscale and upper midscale.
Annualized construction starts are at the highest level since 2008. In 2019, LE forecasts a 2.2% supply growth rate with 1,038 new hotels/118,385 rooms expected to open. For 2020, LE anticipates 1,174 new hotel openings and 128,598 rooms.
Hotel operations had a good quarter but mostly from expense improvements. Only 7 of the top 25 markets showed occupancy increases, quarter-over-quarter (QOQ). Only 11 markets had rev-par increases. Overall, U.S. demand growth was up 2.4% while supply was up 2%.
Leading Markets in the U.S. Hotel Construction Pipeline
In the first quarter of 2019, analysts at Lodging Econometrics (LE) report that the top five markets with the largest hotel construction pipelines are New York City with 170 projects/29,247 rooms. Next are Dallas and Los Angeles, both at record highs, with 163 projects/19,689 rooms and 158 projects/25,578 rooms, respectively. Houston follows with 151 projects/15,643 rooms, and Nashville with 116 projects/15,599 rooms.
Markets with the greatest number of projects already under construction are New York with 119 projects/20,068 rooms, Dallas with 48 projects/6,265 rooms, and Los Angeles with 42 projects/6,288 rooms. Houston has 36 projects/4,162 rooms while Nashville, Austin, and San Jose all have 34 projects presently under construction.
Reflective of the increasing pipeline, LE’s forecast for new hotel openings will continue to rise through 2020. In 2019, New York City tops the list with 63 new hotels expected to open with 9,605 rooms, followed by Dallas with 30 projects/3,604 rooms, Houston with 28 projects/3,342 rooms, Austin with 25 projects/2,512 rooms, and Nashville with 23 projects/3,030 rooms. In the 2020 forecast, New York continues to lead with the highest number of new hotels anticipated to open with 44 projects/6,225 rooms followed by Los Angeles with 35 projects/5,140 rooms and Dallas with 33 projects/4,163 rooms.
The number of markets where supply growth is now exceeding demand growth continues to increase. At the first quarter, 18 of the top 25 markets experienced the shift, up from 12 of the top 25 markets at the end of the fourth quarter of 2018.
Markets of concern where new supply is already outpacing demand and future new openings are forecasted to be high are Houston, New York, Dallas, and Los Angeles.
Related Stories
Market Data | Jul 8, 2020
North America’s construction output to fall by 6.5% in 2020, says GlobalData
Even though all construction activities have been allowed to continue in most parts of the US and Canada since the start of the COVID-19 pandemic, many projects in the bidding or final planning stages have been delayed or canceled.
Market Data | Jul 8, 2020
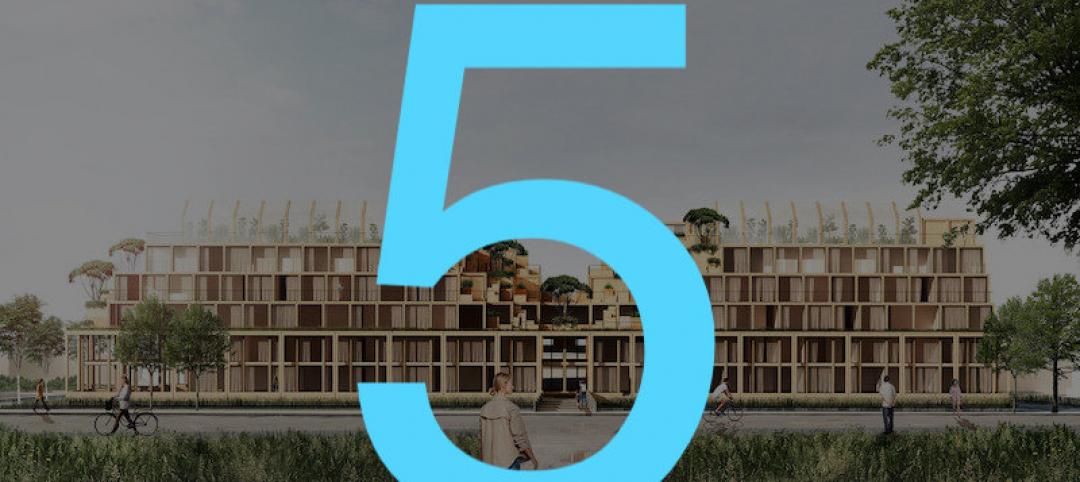
5 must reads for the AEC industry today: July 8, 2020
AEMSEN develops concept for sustainable urban living and nonresidential construction has recovered 56% of jobs lost since March.
Market Data | Jul 7, 2020
Nonresidential construction has recovered 56% of jobs lost since March employment report
Nonresidential construction employment added 74,700 jobs on net in June.

Market Data | Jul 7, 2020
7 must reads for the AEC industry today: July 7, 2020
Construction industry adds 158,000 workers in June and mall owners open micro distribution hubs for e-commerce fulfillment.

Market Data | Jul 6, 2020
Nonresidential construction spending falls modestly in May
Private nonresidential spending declined 2.4% in May and public nonresidential construction spending increased 1.2%.

Market Data | Jul 6, 2020
Construction industry adds 158,000 workers in June but infrastructure jobs decline
Gains in June are concentrated in homebuilding as state and local governments postpone or cancel roads and other projects in face of looming budget deficits.

Market Data | Jul 6, 2020
5 must reads for the AEC industry today: July 6, 2020
Demand growth for mass timber components and office demand has increased as workers return.

Market Data | Jul 2, 2020
Fall in US construction spending in May shows weakness of country’s construction industry, says GlobalData
Dariana Tani, Economist at GlobalData, a leading data and analytics company, offers her view on the situation

Market Data | Jul 2, 2020
6 must reads for the AEC industry today: July 2, 2020
Construction spending declines 2.1% in May and how physical spaces may adapt to a post-COVID world.

Market Data | Jul 1, 2020
Construction spending declines 2.1% in May as drop in private work outweighs public pickup
Federal infrastructure measure can help offset private-sector demand that is likely to remain below pre-coronavirus levels amid economic uncertainty.


