


At the end of the first quarter of 2020, analysts at Lodging Econometrics (LE) report that the total U.S. construction pipeline continued to expand year-over-year (YOY) to 5,731 projects/706,128 rooms, up 1% by projects and 3% by rooms. However, quarter-over-quarter, the pipeline has contracted slightly less than 1% by both project and room counts, down from 5,748 projects/708,898 rooms at the close of 2019.
Projects currently under construction stand at an all-time high of 1,819 projects/243,100 rooms. Projects scheduled to start construction in the next 12 months total 2,284 projects/264,286 rooms, while projects in the early planning stage stand at 1,628 projects/198,742 rooms. Projects in the early planning stage are up 8% by projects and 11% by rooms, YOY. Developers with projects under construction have generally extended their opening dates by two to four months. For projects scheduled to start construction in the next 12 months, on average, developers have adjusted their construction start and opening dates outwards by four to six months. Additionally, brands have been empathetic with developers by relaxing timelines as everyone adjusts to the COVID-19 interruptions. As a result, LE anticipates a stronger count of openings in the second half of 2020, compared to the first half.
In the first quarter of 2020, the U.S. opened 144 new hotels with 16,305 rooms. While the COVID-19 pandemic has slowed development, it has not completely stalled it. There were still 312 new projects with 36,464 rooms announced into the pipeline in the first quarter.
Many open or temporarily closed hotels have already begun or are in the planning stages of renovating and repositioning their assets while occupancy is low or non-existent. At the close of the first quarter, LE recorded 769 active renovation projects/163,030 rooms and 616 active conversion projects/69,258 rooms throughout the United States.
To date, the largest fiscal relief and stimulus efforts include the unprecedented $2 trillion CARES Act, the Paycheck Protection Program (PPP), and the Paycheck Protection Program Liquidity Facility (PPPLF), with a third phase of relief having been signed by the president last week. This third phase includes nearly $500 billion to further support the small-business loan program, as well as provide additional critical funding needed for hospitals and comprehensive testing. A phase four “CARES Act 2” package is already being discussed.
In order to support the economy and build liquidity, the Federal Reserve cut interest rates to almost zero; reduced bank reserve requirements to zero; rapidly purchased hundreds of billions of dollars in treasury bonds and mortgage-backed securities; bought corporate and municipal debt; and extended emergency credit to non-banks. The Federal Reserve has signaled that it will provide more support to the economy if warranted.
Although there are discussions about opening parts of the country that are beginning to stabilize; it will be measured with phased openings designed to effectively balance a highly desired economic ramp up while following prudent health and safety precautions.
*COVID-19 (coronavirus) did not have a full impact on first quarter 2020 U.S. results reported by LE. Only the last 30 days of the quarter were affected. LE’s market intelligence department has and will continue to gather the necessary global intelligence on the supply side of the lodging industry and make that information available to our subscribers. It is still early to predict the full impact of the outbreak on the lodging industry. We will have more information to report in the coming months.
Related Stories

Contractors | Jul 13, 2023
Construction input prices remain unchanged in June, inflation slowing
Construction input prices remained unchanged in June compared to the previous month, according to an Associated Builders and Contractors analysis of U.S. Bureau of Labor Statistics Producer Price Index data released today. Nonresidential construction input prices were also unchanged for the month.

Contractors | Jul 11, 2023
The average U.S. contractor has 8.9 months worth of construction work in the pipeline, as of June 2023
Associated Builders and Contractors reported that its Construction Backlog Indicator remained unchanged at 8.9 months in June 2023, according to an ABC member survey conducted June 20 to July 5. The reading is unchanged from June 2022.

Market Data | Jul 5, 2023
Nonresidential construction spending decreased in May, its first drop in nearly a year
National nonresidential construction spending decreased 0.2% in May, according to an Associated Builders and Contractors analysis of data published today by the U.S. Census Bureau. On a seasonally adjusted annualized basis, nonresidential spending totaled $1.06 trillion.

Apartments | Jun 27, 2023
Average U.S. apartment rent reached all-time high in May, at $1,716
Multifamily rents continued to increase through the first half of 2023, despite challenges for the sector and continuing economic uncertainty. But job growth has remained robust and new households keep forming, creating apartment demand and ongoing rent growth. The average U.S. apartment rent reached an all-time high of $1,716 in May.

Industry Research | Jun 15, 2023
Exurbs and emerging suburbs having fastest population growth, says Cushman & Wakefield
Recently released county and metro-level population growth data by the U.S. Census Bureau shows that the fastest growing areas are found in exurbs and emerging suburbs.

Contractors | Jun 13, 2023
The average U.S. contractor has 8.9 months worth of construction work in the pipeline, as of May 2023
Associated Builders and Contractors reported that its Construction Backlog Indicator remained unchanged at 8.9 months in May, according to an ABC member survey conducted May 20 to June 7. The reading is 0.1 months lower than in May 2022. Backlog in the infrastructure category ticked up again and has now returned to May 2022 levels. On a regional basis, backlog increased in every region but the Northeast.
Industry Research | Jun 13, 2023
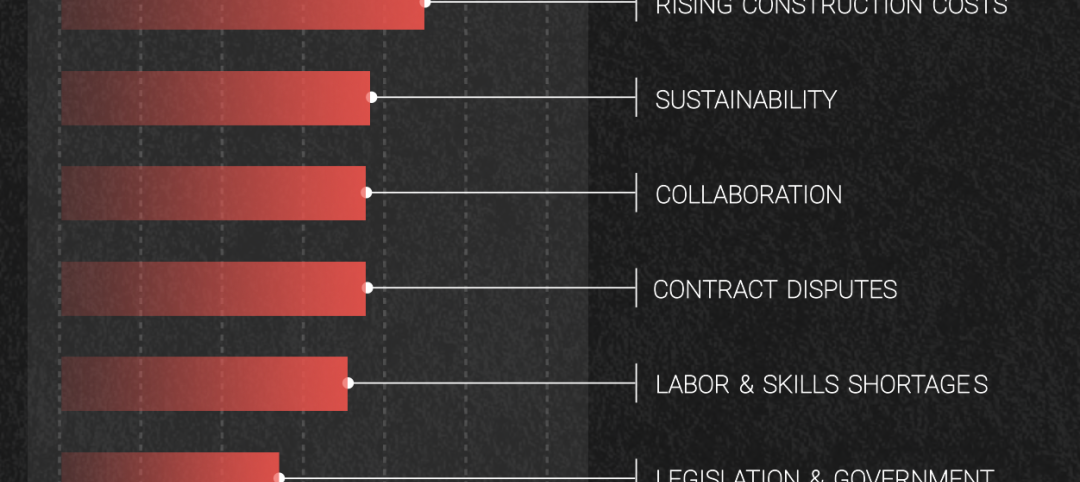
Two new surveys track how the construction industry, in the U.S. and globally, is navigating market disruption and volatility
The surveys, conducted by XYZ Reality and KPMG International, found greater willingness to embrace technology, workplace diversity, and ESG precepts.
| Jun 5, 2023
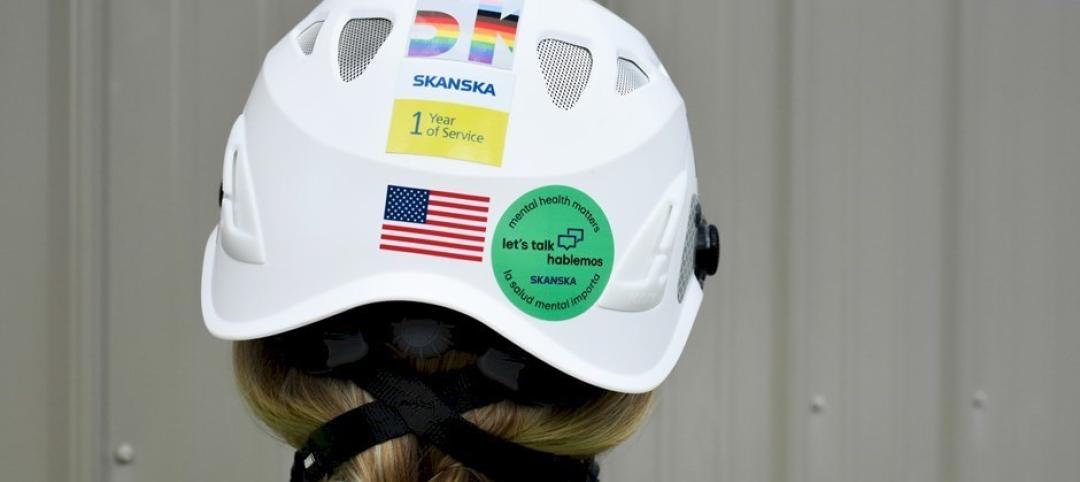
Communication is the key to AEC firms’ mental health programs and training
The core of recent awareness efforts—and their greatest challenge—is getting workers to come forward and share stories.

Contractors | May 24, 2023
The average U.S. contractor has 8.9 months worth of construction work in the pipeline, as of April 2023
Contractor backlogs climbed slightly in April, from a seven-month low the previous month, according to Associated Builders and Contractors.

Multifamily Housing | May 23, 2023
One out of three office buildings in largest U.S. cities are suitable for residential conversion
Roughly one in three office buildings in the largest U.S. cities are well suited to be converted to multifamily residential properties, according to a study by global real estate firm Avison Young. Some 6,206 buildings across 10 U.S. cities present viable opportunities for conversion to residential use.


