


The U.S. Energy Information Administration has posted preliminary results from its periodic Commercial Buildings Energy Consumption survey. Data for the project were collected in 2012 and detailed analyses of energy consumption will be released beginning next spring. The project includes buildings >1,000 sf that devote more than half of their floorspace to activity that is not residential, manufacturing, industrial, or agricultural.
The preliminary results from the Commercial Buildings Energy Consumption Survey (CBECS) show that there were 5.6 million commercial buildings in the United States in 2012, comprising 87.4 billion square feet of floorspace. This represents a 14% increase in the number of buildings and a 22% increase in floorspace since 2003, the last year for which CBECS results are available.
The preliminary data can be found in this summary table of building counts and total square footage by building size category, principal building activity, year of construction category, Census region, and Census division. The first tab provides the estimates; the second tab on the table provides relative standard errors (RSEs) for the estimates.
For comparison, there is a similar summary table from the 2003 CBECS. Other file formats for the same table can be accessed from the 2003 CBECS data page.
The size, use, vintage, and geographic region of a building are among the key determinants that influence its energy use. Subsequent releases will show more detailed characteristics and crosstabulations among key categories. This is the first release of many reports and data releases expected for the 2012 CBECS; these preliminary tables provide a first look at the building stock and the attributes that drive commercial energy use.
Trends – 1979 to 2012: Growth in building size outpaces increases in building stock
Since the first CBECS was conducted in 1979 to the current 2012 CBECS, the number of buildings has increased from 3.8 million to 5.6 million, and the amount of commercial floorspace has increased from 51 billion to 87 billion square feet.

HOW DOES EIA PRODUCE RELIABLE RESULTS FROM A SAMPLE SURVEY?
The CBECS is a national sample survey. See How Were Buildings Selected for the 2012 CBECS? for an overview of the sampling process. After the sample was selected, preparations for the interviewing phase began. In April 2013, about 250 field interviewers were trained to visit buildings across the United States and recruit respondents knowledgeable about energy use in the buildings. After recruiting a respondent at a building, the field interviewer’s job was to conduct an interview on a laptop computer asking questions about the building’s structure, use, energy equipment, and energy use. Between April and November 2013, interviews were conducted in-person or by telephone at over 6,500 buildings nationwide. Because every building had a chance to be selected and that chance is known, a sample weight can be assigned to each case. The resulting dataset is representative of the entire U.S. commercial building population.
Principal building activities: The most prevalent building types account for the majority of the total buildings and floorspace, while the building types with the largest average buildings are less common in the building stock
The commercial building sector is characterized by diversity. The 2012 survey identified more than 100 subcategories of building activity, which are aggregated into the 14 principal building activities shown in the summary table and in the figures below. CBECS includes buildings as small and singular in activity as a freestanding bank or fast food restaurant, to buildings as large and complex as an office building with hundreds of tenants or a major airport terminal. CBECS also includes vacant buildings; some vacant buildings use energy, either for maintenance purposes or because a small amount of space is still used in the building1.

Among the general building activities, lodging, education, and health care are the largest buildings, on average. The health care category's average is greatly affected by the size of inpatient health care buildings (i.e., hospitals), which have an average size of 247,700 square feet per building, compared to outpatient health care buildings, which have an average size of 12,100 square feet.

Figure 4 tracks changes in the building stock over the past 10 years by comparing the number of buildings for each principal building activity from 2003 to 2012. The highest percent of growth was in vacant buildings and other types of buildings, which includes buildings such as airplane hangars, laboratories and data centers. Warehouses, food service buildings, public assembly, and office buildings also increased between 2003 and 2012, while food sales buildings (e.g., grocery and convenience stores) showed a decrease,2 and mercantile (retail and malls) showed a decrease, although it is not statistically significant. Because CBECS is a sample survey, each estimate has sampling error associated with it, which should be considered when comparing estimates. See What is an RSE? and Estimation of Standard Errors for more information.

Size of buildings: Although there are relatively few very large buildings (over 100,000 square feet of floorspace), they account for more than one-third of total commercial building floorspace
Commercial buildings are often depicted showing a skyline of towering buildings. However, the vast majority of commercial buildings are relatively small. Just less than half of buildings are 5,000 square feet in size or smaller, and nearly three-fourths are 10,000 square feet or smaller. The median building size is 5,100 square feet (i.e., half the buildings are larger than this and half are smaller), while the average size is 15,700 square feet. The average is larger than the median because of the influence of a small number of very large buildings; buildings over 100,000 square feet make up only about 2% of the building count but about 35% of the total floorspace.

Year constructed: The commercial building stock is middle-aged, and newer buildings are larger than older ones
Commercial buildings remain in use for many decades. Although about 12% of commercial buildings (comprising 14% of commercial floorspace) were built in the past 10 years, the commercial building stock is still fairly old, with about half of all buildings constructed at least 35 years ago. However, in the existing building stock, there are more buildings built in the 2000s than buildings built prior to 1946.

Newer buildings tend to be larger than older buildings. The average building size for those constructed before 1960 is 12,000 square feet; buildings constructed between 1960 and 1999 average 16,300 square feet; and buildings constructed in the 2000s average 19,100 square feet. The differences between these average building sizes are statistically significant.

Census region and division (see map): The South has the most commercial buildings, but the Northeast has the largest commercial buildings
The South Census region, the most populous of the four Census regions, has the largest percentage of commercial buildings and commercial floorspace, with about 40% of both total buildings and floorspace. The Midwest and West regions each account for more than one-fifth of commercial buildings and floorspace.

Buildings in the Northeast region are, on average, 4,000 to 5,000 square feet larger than buildings in the other regions. The Northeast region includes the Middle Atlantic division (New York, Pennsylvania, and New Jersey), where buildings average 22,400 square feet.

Footnote
1 CBECS principal building activity is defined as the activity occupying the most floorspace. Respondents are first asked if there is one activity that occupies 75% or more of the floorspace. If not, CBECS collects the top three building activities and their corresponding percents and the principal activity is assigned as the one comprising the most floorspace.
2 Estimates for number of food sales buildings can be somewhat misleading because grocery stores and convenience stores are often part of strip malls and therefore included in the "Enclosed and strip malls" category in CBECS. "Enclosed and strip malls" is a subcategory of "Mercantile" and is shown in the summary table.
Specific questions on this product may be directed to Joelle Michaels.
Related Stories

Market Data | Jan 6, 2023
Nonresidential construction spending rises in November 2022
Spending on nonresidential construction work in the U.S. was up 0.9% in November versus the previous month, and 11.8% versus the previous year, according to the U.S. Census Bureau.

Industry Research | Dec 28, 2022
Following a strong year, design and construction firms view 2023 cautiously
The economy and inflation are the biggest concerns for U.S. architecture, construction, and engineering firms in 2023, according to a recent survey of AEC professionals by the editors of Building Design+Construction.

Performing Arts Centers | Dec 23, 2022
Diller Scofidio + Renfro's renovation of Dallas theater to be ‘faithful reinterpretation’ of Frank Lloyd Wright design
Diller Scofidio + Renfro recently presented plans to restore the Kalita Humphreys Theater at the Dallas Theater Center (DTC) in Dallas. Originally designed by Frank Lloyd Wright, this theater is the only freestanding theater in Wright’s body of work.

University Buildings | Dec 22, 2022
Loyola Marymount University completes a new home for its acclaimed School of Film and Television
California’s Loyola Marymount University (LMU) has completed two new buildings for arts and media education at its Westchester campus. Designed by Skidmore, Owings & Merrill (SOM), the Howard B. Fitzpatrick Pavilion is the new home of the undergraduate School of Film and Television, which is consistently ranked among the nation’s top 10 film schools. Also designed by SOM, the open-air Drollinger Family Stage is an outdoor lecture and performance space.

Adaptive Reuse | Dec 21, 2022
University of Pittsburgh reinvents century-old Model-T building as a life sciences research facility
After opening earlier this year, The Assembly recently achieved LEED Gold certification, aligning with the school’s and community’s larger sustainability efforts.

Multifamily Housing | Dec 20, 2022
Brooks + Scarpa-designed apartment provides affordable housing to young people aging out of support facilities
In Venice, Calif., the recently completed Rose Apartments provides affordable housing to young people who age out of youth facilities and often end up living on the street. Designed by Brooks + Scarpa, the four-story, 35-unit mixed-use apartment building will house transitional aged youths.

Coatings | Dec 20, 2022
The Pier Condominiums — What's old is new again!
When word was out that the condominium association was planning to carry out a refresh of the Pier Condominiums on Fort Norfolk, Hanbury jumped at the chance to remake what had become a tired, faded project.
Cladding and Facade Systems | Dec 20, 2022
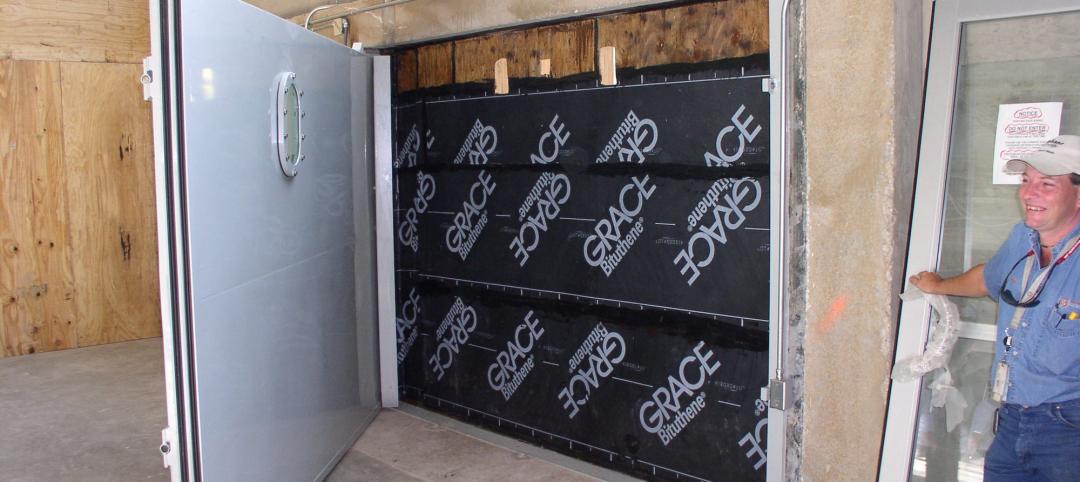
Acoustic design considerations at the building envelope
Acentech's Ben Markham identifies the primary concerns with acoustic performance at the building envelope and offers proven solutions for mitigating acoustic issues.
Sponsored | Resiliency | Dec 14, 2022
Flood protection: What building owners need to know to protect their properties
This course from Walter P Moore examines numerous flood protection approaches and building owner needs before delving into the flood protection process. Determining the flood resilience of a property can provide a good understanding of risk associated costs.

Architects | Dec 14, 2022
Carol Ross Barney, FAIA, named 2023 AIA Gold Medal honoree
The Board of Directors and the Strategic Council of the American Institute of Architects (AIA) are honoring Carol Ross Barney, FAIA, with the 2023 Gold Medal. The Gold Medal honors an individual whose significant body of work has had a lasting influence on the theory and practice of architecture.


