


The U.S. Energy Information Administration has posted preliminary results from its periodic Commercial Buildings Energy Consumption survey. Data for the project were collected in 2012 and detailed analyses of energy consumption will be released beginning next spring. The project includes buildings >1,000 sf that devote more than half of their floorspace to activity that is not residential, manufacturing, industrial, or agricultural.
The preliminary results from the Commercial Buildings Energy Consumption Survey (CBECS) show that there were 5.6 million commercial buildings in the United States in 2012, comprising 87.4 billion square feet of floorspace. This represents a 14% increase in the number of buildings and a 22% increase in floorspace since 2003, the last year for which CBECS results are available.
The preliminary data can be found in this summary table of building counts and total square footage by building size category, principal building activity, year of construction category, Census region, and Census division. The first tab provides the estimates; the second tab on the table provides relative standard errors (RSEs) for the estimates.
For comparison, there is a similar summary table from the 2003 CBECS. Other file formats for the same table can be accessed from the 2003 CBECS data page.
The size, use, vintage, and geographic region of a building are among the key determinants that influence its energy use. Subsequent releases will show more detailed characteristics and crosstabulations among key categories. This is the first release of many reports and data releases expected for the 2012 CBECS; these preliminary tables provide a first look at the building stock and the attributes that drive commercial energy use.
Trends – 1979 to 2012: Growth in building size outpaces increases in building stock
Since the first CBECS was conducted in 1979 to the current 2012 CBECS, the number of buildings has increased from 3.8 million to 5.6 million, and the amount of commercial floorspace has increased from 51 billion to 87 billion square feet.

HOW DOES EIA PRODUCE RELIABLE RESULTS FROM A SAMPLE SURVEY?
The CBECS is a national sample survey. See How Were Buildings Selected for the 2012 CBECS? for an overview of the sampling process. After the sample was selected, preparations for the interviewing phase began. In April 2013, about 250 field interviewers were trained to visit buildings across the United States and recruit respondents knowledgeable about energy use in the buildings. After recruiting a respondent at a building, the field interviewer’s job was to conduct an interview on a laptop computer asking questions about the building’s structure, use, energy equipment, and energy use. Between April and November 2013, interviews were conducted in-person or by telephone at over 6,500 buildings nationwide. Because every building had a chance to be selected and that chance is known, a sample weight can be assigned to each case. The resulting dataset is representative of the entire U.S. commercial building population.
Principal building activities: The most prevalent building types account for the majority of the total buildings and floorspace, while the building types with the largest average buildings are less common in the building stock
The commercial building sector is characterized by diversity. The 2012 survey identified more than 100 subcategories of building activity, which are aggregated into the 14 principal building activities shown in the summary table and in the figures below. CBECS includes buildings as small and singular in activity as a freestanding bank or fast food restaurant, to buildings as large and complex as an office building with hundreds of tenants or a major airport terminal. CBECS also includes vacant buildings; some vacant buildings use energy, either for maintenance purposes or because a small amount of space is still used in the building1.

Among the general building activities, lodging, education, and health care are the largest buildings, on average. The health care category's average is greatly affected by the size of inpatient health care buildings (i.e., hospitals), which have an average size of 247,700 square feet per building, compared to outpatient health care buildings, which have an average size of 12,100 square feet.

Figure 4 tracks changes in the building stock over the past 10 years by comparing the number of buildings for each principal building activity from 2003 to 2012. The highest percent of growth was in vacant buildings and other types of buildings, which includes buildings such as airplane hangars, laboratories and data centers. Warehouses, food service buildings, public assembly, and office buildings also increased between 2003 and 2012, while food sales buildings (e.g., grocery and convenience stores) showed a decrease,2 and mercantile (retail and malls) showed a decrease, although it is not statistically significant. Because CBECS is a sample survey, each estimate has sampling error associated with it, which should be considered when comparing estimates. See What is an RSE? and Estimation of Standard Errors for more information.

Size of buildings: Although there are relatively few very large buildings (over 100,000 square feet of floorspace), they account for more than one-third of total commercial building floorspace
Commercial buildings are often depicted showing a skyline of towering buildings. However, the vast majority of commercial buildings are relatively small. Just less than half of buildings are 5,000 square feet in size or smaller, and nearly three-fourths are 10,000 square feet or smaller. The median building size is 5,100 square feet (i.e., half the buildings are larger than this and half are smaller), while the average size is 15,700 square feet. The average is larger than the median because of the influence of a small number of very large buildings; buildings over 100,000 square feet make up only about 2% of the building count but about 35% of the total floorspace.

Year constructed: The commercial building stock is middle-aged, and newer buildings are larger than older ones
Commercial buildings remain in use for many decades. Although about 12% of commercial buildings (comprising 14% of commercial floorspace) were built in the past 10 years, the commercial building stock is still fairly old, with about half of all buildings constructed at least 35 years ago. However, in the existing building stock, there are more buildings built in the 2000s than buildings built prior to 1946.

Newer buildings tend to be larger than older buildings. The average building size for those constructed before 1960 is 12,000 square feet; buildings constructed between 1960 and 1999 average 16,300 square feet; and buildings constructed in the 2000s average 19,100 square feet. The differences between these average building sizes are statistically significant.

Census region and division (see map): The South has the most commercial buildings, but the Northeast has the largest commercial buildings
The South Census region, the most populous of the four Census regions, has the largest percentage of commercial buildings and commercial floorspace, with about 40% of both total buildings and floorspace. The Midwest and West regions each account for more than one-fifth of commercial buildings and floorspace.

Buildings in the Northeast region are, on average, 4,000 to 5,000 square feet larger than buildings in the other regions. The Northeast region includes the Middle Atlantic division (New York, Pennsylvania, and New Jersey), where buildings average 22,400 square feet.

Footnote
1 CBECS principal building activity is defined as the activity occupying the most floorspace. Respondents are first asked if there is one activity that occupies 75% or more of the floorspace. If not, CBECS collects the top three building activities and their corresponding percents and the principal activity is assigned as the one comprising the most floorspace.
2 Estimates for number of food sales buildings can be somewhat misleading because grocery stores and convenience stores are often part of strip malls and therefore included in the "Enclosed and strip malls" category in CBECS. "Enclosed and strip malls" is a subcategory of "Mercantile" and is shown in the summary table.
Specific questions on this product may be directed to Joelle Michaels.
Related Stories
| Feb 11, 2011
Four Products That Stand Up to Hurricanes
What do a panelized wall system, a newly developed roof hatch, spray polyurethane foam, and a custom-made curtain wall have in common? They’ve been extensively researched and tested for their ability to take abuse from the likes of Hurricane Katrina.
| Feb 11, 2011
RS Means Cost Comparison Chart: Office Buildings
This month's RS Means Cost Comparison Chart focuses on office building construction.
| Feb 11, 2011
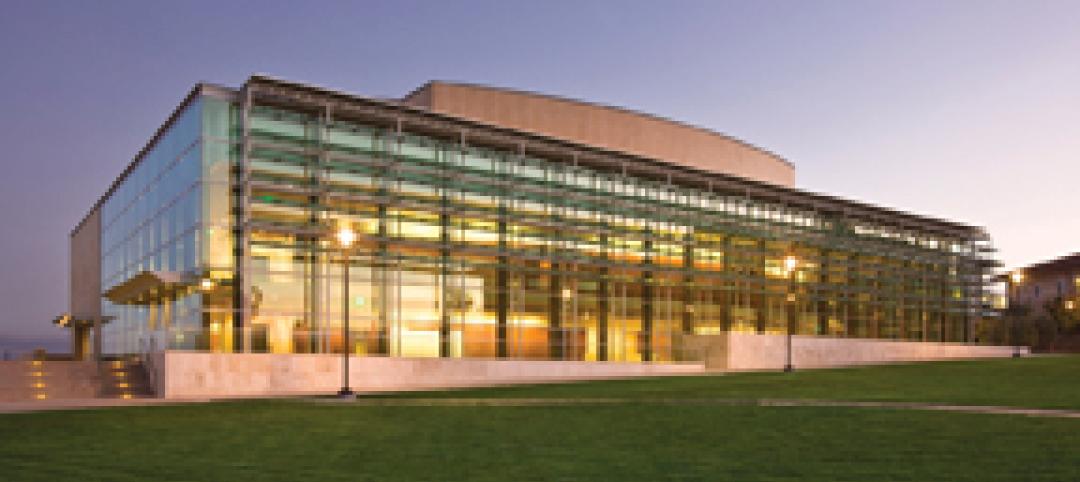
Sustainable features on the bill for dual-building performing arts center at Soka University of America
The $73 million Soka University of America’s new performing arts center and academic complex recently opened on the school’s Aliso Viejo, Calif., campus. McCarthy Building Companies and Zimmer Gunsul Frasca Architects collaborated on the two-building project. One is a three-story, 47,836-sf facility with a grand reception lobby, a 1,200-seat auditorium, and supports spaces. The other is a four-story, 48,974-sf facility with 11 classrooms, 29 faculty offices, a 150-seat black box theater, rehearsal/dance studio, and support spaces. The project, which has a green roof, solar panels, operable windows, and sun-shading devices, is going for LEED Silver.
| Feb 11, 2011
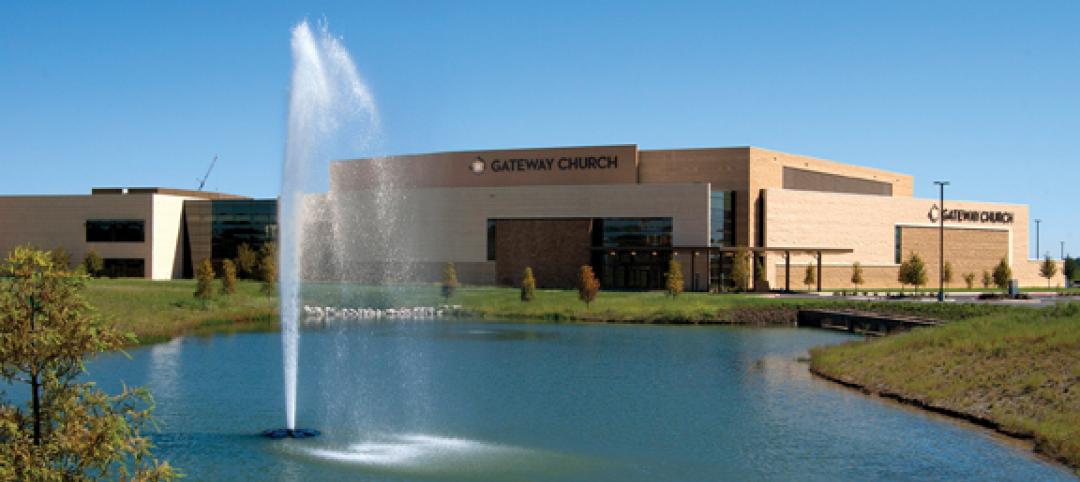
BIM-enabled Texas church complex can broadcast services in high-def
After two years of design and construction, members of the Gateway Church in Southland, Texas, were able to attend services in their new 4,000-seat facility in late 2010. Located on a 180-acre site, the 205,000-sf complex has six auditoriums, including a massive 200,000-sf Worship Center, complete with catwalks, top-end audio and video system, and high-definition broadcast capabilities. BIM played a significant role in the building’s design and construction. Balfour Beatty Construction and Beck Architecture formed the nucleus of the Building Team.
| Feb 11, 2011
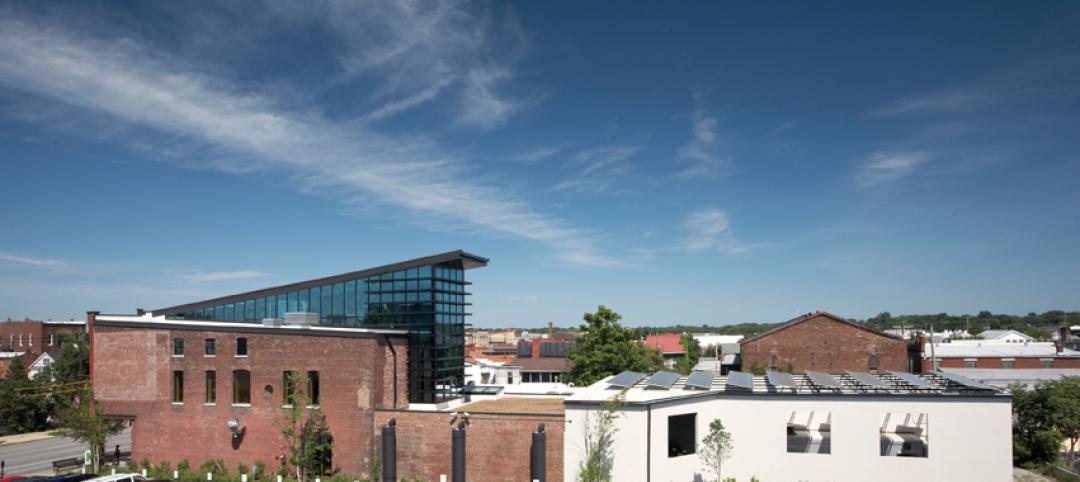
Kentucky’s first green adaptive reuse project earns Platinum
(FER) studio, Inglewood, Calif., converted a 115-year-old former dry goods store in Louisville, Ky., into a 10,175-sf mixed-use commercial building earned LEED Platinum and holds the distinction of being the state’s first adaptive reuse project to earn any LEED rating. The facility, located in the East Market District, houses a gallery, event space, offices, conference space, and a restaurant. Sustainable elements that helped the building reach its top LEED rating include xeriscaping, a green roof, rainwater collection and reuse, 12 geothermal wells, 81 solar panels, a 1,100-gallon ice storage system (off-grid energy efficiency is 68%) and the reuse and recycling of construction materials. Local firm Peters Construction served as GC.
| Feb 11, 2011
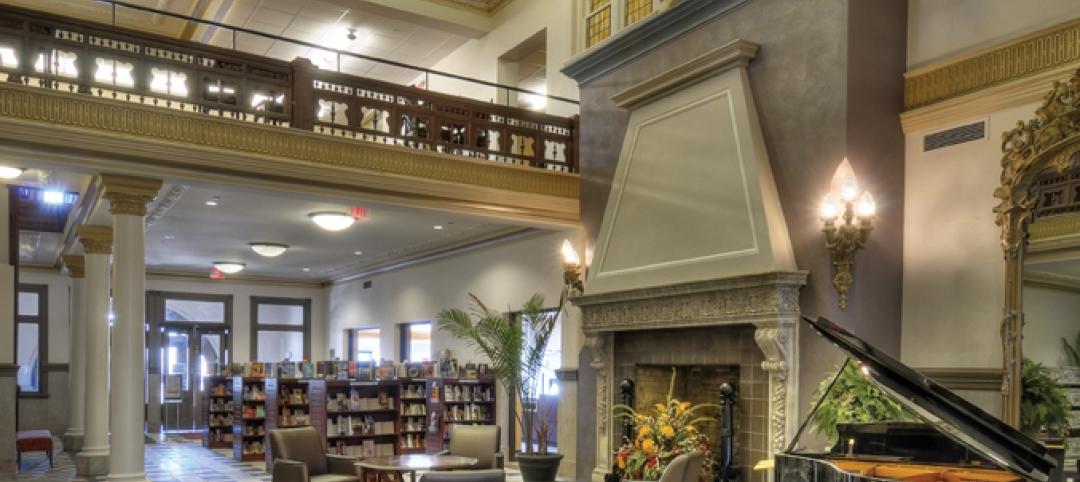
Former Richardson Romanesque hotel now houses books, not beds
The Piqua (Ohio) Public Library was once a late 19th-century hotel that sat vacant and deteriorating for years before a $12.3 million adaptive reuse project revitalized the 1891 building. The design team of PSA-Dewberry, MKC Associates, and historic preservation specialist Jeff Wray Associates collaborated on the restoration of the 80,000-sf Richardson Romanesque building, once known as the Fort Piqua Hotel. The team restored a mezzanine above the lobby and repaired historic windows, skylight, massive fireplace, and other historic details. The basement, with its low ceiling and stacked stone walls, was turned into a castle-like children’s center. The Piqua Historical Museum is also located within the building.
| Feb 11, 2011
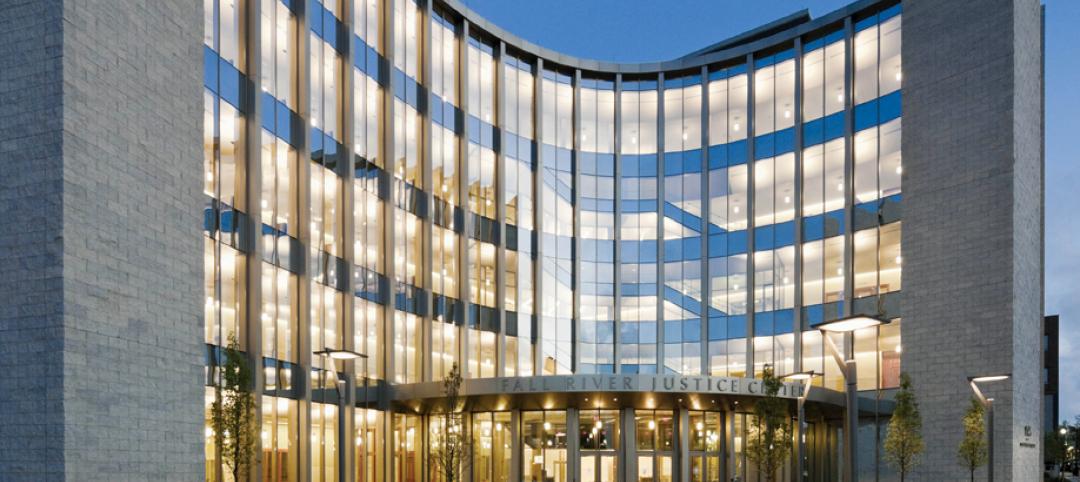
Justice center on Fall River harbor serves up daylight, sustainable elements, including eucalyptus millwork
Located on historic South Main Street in Fall River, Mass., the Fall River Justice Center opened last fall to serve as the city’s Superior and District Courts building. The $85 million facility was designed by Boston-based Finegold Alexander + Associates Inc., with Dimeo Construction as CM and Arup as MEP. The 154,000-sf courthouse contains nine courtrooms, a law library, and a detention area. Most of the floors have the same ceiling height, which will makes them easier to reconfigure in the future as space needs change. Designed to achieve LEED Silver, the facility’s elliptical design offers abundant natural daylight and views of the harbor. Renewable eucalyptus millwork is one of the sustainable features.
| Feb 11, 2011
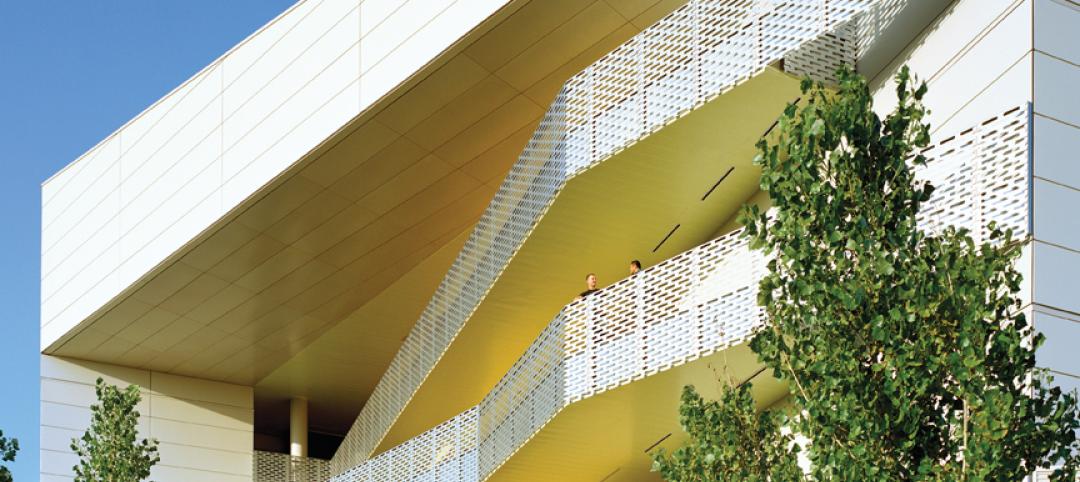
Research facility separates but also connects lab spaces
California State University, Northridge, consolidated its graduate and undergraduate biology and mathematics programs into one 90,000-sf research facility. Architect of record Cannon Design worked on the new Chaparral Hall, creating a four-story facility with two distinct spaces that separate research and teaching areas; these are linked by faculty offices to create collaborative spaces. The building houses wet research, teaching, and computational research labs, a 5,000-sf vivarium, classrooms, and administrative offices. A four-story outdoor lobby and plaza and an outdoor staircase provide orientation. A covered walkway links the new facility with the existing science complex. Saiful/Bouquet served as structural engineer, Bard, Rao + Athanas Consulting Engineers served as MEP, and Research Facilities Design was laboratory consultant.
| Feb 11, 2011
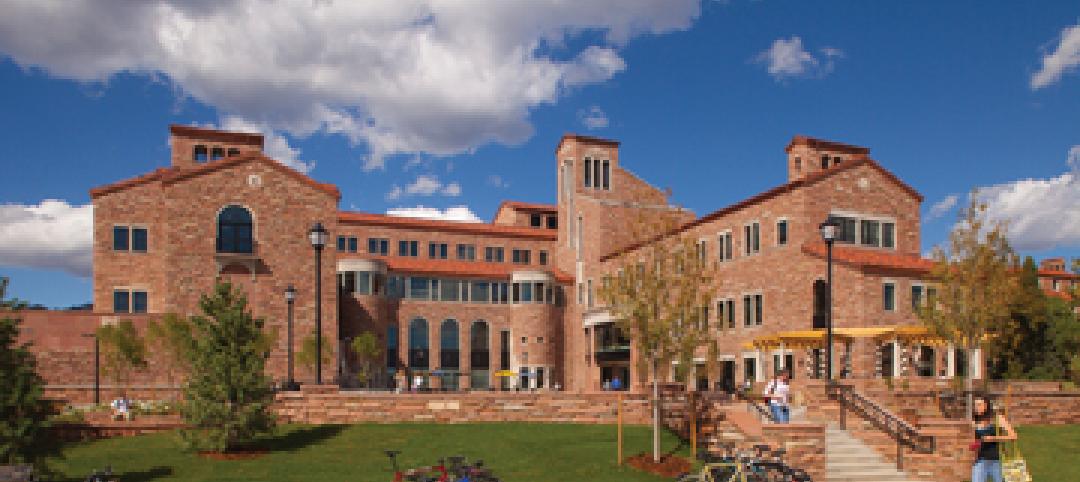
A feast of dining options at University of Colorado community center, but hold the buffalo stew
The University of Colorado, Boulder, cooked up something different with its new $84.4 million Center for Community building, whose 900-seat foodservice area consists of 12 micro-restaurants, each with its own food options and décor. Centerbrook Architects of Connecticut collaborated with Denver’s Davis Partnership Architects and foodservice designer Baker Group of Grand Rapids, Mich., on the 323,000-sf facility, which also includes space for a career center, international education, and counseling and psychological services. Exterior walls of rough-hewn, variegated sandstone and a terra cotta roof help the new facility blend with existing campus buildings. Target: LEED Gold.

| Feb 11, 2011
Chicago high-rise mixes condos with classrooms for Art Institute students
The Legacy at Millennium Park is a 72-story, mixed-use complex that rises high above Chicago’s Michigan Avenue. The glass tower, designed by Solomon Cordwell Buenz, is mostly residential, but also includes 41,000 sf of classroom space for the School of the Art Institute of Chicago and another 7,400 sf of retail space. The building’s 355 one-, two-, three-, and four-bedroom condominiums range from 875 sf to 9,300 sf, and there are seven levels of parking. Sky patios on the 15th, 42nd, and 60th floors give owners outdoor access and views of Lake Michigan.


