


The U.S. Energy Information Administration has posted preliminary results from its periodic Commercial Buildings Energy Consumption survey. Data for the project were collected in 2012 and detailed analyses of energy consumption will be released beginning next spring. The project includes buildings >1,000 sf that devote more than half of their floorspace to activity that is not residential, manufacturing, industrial, or agricultural.
The preliminary results from the Commercial Buildings Energy Consumption Survey (CBECS) show that there were 5.6 million commercial buildings in the United States in 2012, comprising 87.4 billion square feet of floorspace. This represents a 14% increase in the number of buildings and a 22% increase in floorspace since 2003, the last year for which CBECS results are available.
The preliminary data can be found in this summary table of building counts and total square footage by building size category, principal building activity, year of construction category, Census region, and Census division. The first tab provides the estimates; the second tab on the table provides relative standard errors (RSEs) for the estimates.
For comparison, there is a similar summary table from the 2003 CBECS. Other file formats for the same table can be accessed from the 2003 CBECS data page.
The size, use, vintage, and geographic region of a building are among the key determinants that influence its energy use. Subsequent releases will show more detailed characteristics and crosstabulations among key categories. This is the first release of many reports and data releases expected for the 2012 CBECS; these preliminary tables provide a first look at the building stock and the attributes that drive commercial energy use.
Trends – 1979 to 2012: Growth in building size outpaces increases in building stock
Since the first CBECS was conducted in 1979 to the current 2012 CBECS, the number of buildings has increased from 3.8 million to 5.6 million, and the amount of commercial floorspace has increased from 51 billion to 87 billion square feet.

HOW DOES EIA PRODUCE RELIABLE RESULTS FROM A SAMPLE SURVEY?
The CBECS is a national sample survey. See How Were Buildings Selected for the 2012 CBECS? for an overview of the sampling process. After the sample was selected, preparations for the interviewing phase began. In April 2013, about 250 field interviewers were trained to visit buildings across the United States and recruit respondents knowledgeable about energy use in the buildings. After recruiting a respondent at a building, the field interviewer’s job was to conduct an interview on a laptop computer asking questions about the building’s structure, use, energy equipment, and energy use. Between April and November 2013, interviews were conducted in-person or by telephone at over 6,500 buildings nationwide. Because every building had a chance to be selected and that chance is known, a sample weight can be assigned to each case. The resulting dataset is representative of the entire U.S. commercial building population.
Principal building activities: The most prevalent building types account for the majority of the total buildings and floorspace, while the building types with the largest average buildings are less common in the building stock
The commercial building sector is characterized by diversity. The 2012 survey identified more than 100 subcategories of building activity, which are aggregated into the 14 principal building activities shown in the summary table and in the figures below. CBECS includes buildings as small and singular in activity as a freestanding bank or fast food restaurant, to buildings as large and complex as an office building with hundreds of tenants or a major airport terminal. CBECS also includes vacant buildings; some vacant buildings use energy, either for maintenance purposes or because a small amount of space is still used in the building1.

Among the general building activities, lodging, education, and health care are the largest buildings, on average. The health care category's average is greatly affected by the size of inpatient health care buildings (i.e., hospitals), which have an average size of 247,700 square feet per building, compared to outpatient health care buildings, which have an average size of 12,100 square feet.

Figure 4 tracks changes in the building stock over the past 10 years by comparing the number of buildings for each principal building activity from 2003 to 2012. The highest percent of growth was in vacant buildings and other types of buildings, which includes buildings such as airplane hangars, laboratories and data centers. Warehouses, food service buildings, public assembly, and office buildings also increased between 2003 and 2012, while food sales buildings (e.g., grocery and convenience stores) showed a decrease,2 and mercantile (retail and malls) showed a decrease, although it is not statistically significant. Because CBECS is a sample survey, each estimate has sampling error associated with it, which should be considered when comparing estimates. See What is an RSE? and Estimation of Standard Errors for more information.

Size of buildings: Although there are relatively few very large buildings (over 100,000 square feet of floorspace), they account for more than one-third of total commercial building floorspace
Commercial buildings are often depicted showing a skyline of towering buildings. However, the vast majority of commercial buildings are relatively small. Just less than half of buildings are 5,000 square feet in size or smaller, and nearly three-fourths are 10,000 square feet or smaller. The median building size is 5,100 square feet (i.e., half the buildings are larger than this and half are smaller), while the average size is 15,700 square feet. The average is larger than the median because of the influence of a small number of very large buildings; buildings over 100,000 square feet make up only about 2% of the building count but about 35% of the total floorspace.

Year constructed: The commercial building stock is middle-aged, and newer buildings are larger than older ones
Commercial buildings remain in use for many decades. Although about 12% of commercial buildings (comprising 14% of commercial floorspace) were built in the past 10 years, the commercial building stock is still fairly old, with about half of all buildings constructed at least 35 years ago. However, in the existing building stock, there are more buildings built in the 2000s than buildings built prior to 1946.

Newer buildings tend to be larger than older buildings. The average building size for those constructed before 1960 is 12,000 square feet; buildings constructed between 1960 and 1999 average 16,300 square feet; and buildings constructed in the 2000s average 19,100 square feet. The differences between these average building sizes are statistically significant.

Census region and division (see map): The South has the most commercial buildings, but the Northeast has the largest commercial buildings
The South Census region, the most populous of the four Census regions, has the largest percentage of commercial buildings and commercial floorspace, with about 40% of both total buildings and floorspace. The Midwest and West regions each account for more than one-fifth of commercial buildings and floorspace.

Buildings in the Northeast region are, on average, 4,000 to 5,000 square feet larger than buildings in the other regions. The Northeast region includes the Middle Atlantic division (New York, Pennsylvania, and New Jersey), where buildings average 22,400 square feet.

Footnote
1 CBECS principal building activity is defined as the activity occupying the most floorspace. Respondents are first asked if there is one activity that occupies 75% or more of the floorspace. If not, CBECS collects the top three building activities and their corresponding percents and the principal activity is assigned as the one comprising the most floorspace.
2 Estimates for number of food sales buildings can be somewhat misleading because grocery stores and convenience stores are often part of strip malls and therefore included in the "Enclosed and strip malls" category in CBECS. "Enclosed and strip malls" is a subcategory of "Mercantile" and is shown in the summary table.
Specific questions on this product may be directed to Joelle Michaels.
Related Stories

| Jan 24, 2014
Urban Land Institute, Enterprise outline issues in rental housing shortage: Report
Bending the Cost Curve: Solutions to Expand the Supply of Affordable Rentals outlines factors that impede the development of affordable rental housing – causing the supply in many markets to fall far short of the demand.

| Jan 24, 2014
ZGF announces formal partnership with Vancouver's Cotter Architects
ZGF has announced the formal establishment of a Vancouver, British Columbia, presence in partnership with Cotter Architects.

| Jan 24, 2014
Structural concrete requirements under revision: ACI 318 standard
The American Concrete Institute (ACI), an organization whose mission is to develop and disseminate consensus-based knowledge on concrete and its uses, is finalizing a completely reorganized ACI 318-14: Building Code Requirements for Structural Concrete.
| Jan 23, 2014
SMPS Announces Call for Entries for 37th Annual Marketing Communications Awards Program
The Society for Marketing Professional Services (SMPS) is accepting entries for its 37th Annual Marketing Communications Awards (MCA) competition. The MCA program is the longest-standing, most prestigious awards program recognizing excellence in marketing communications by professional services firms in the design and building industry. The entry deadline is March 3, 2014. SMPS members and nonmembers are eligible to enter.

| Jan 23, 2014
Adrian Smith + Gordon Gill-designed Federation of Korean Industries tower opens in Seoul [slideshow]
The 50-story tower features a unique, angled building-integrated photovoltaic (BIPV) exterior designed to maximize the amount of energy collected.
| Jan 23, 2014
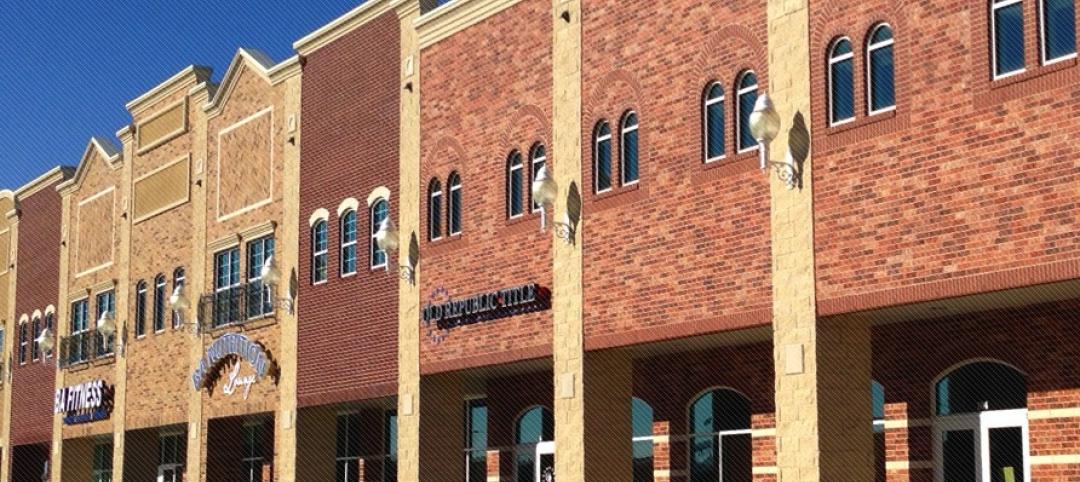
Think you can recognize a metal building from the outside?
What looks like brick, stucco or wood on the outside could actually be a metal building. Metal is no longer easily detectable. It’s gotten sneakier visually. And a great example of that is the Madison Square retail center in Norman, Okla.

| Jan 23, 2014
3 fatal flaws your architecture firm has right now
After visiting over 200 architecture firms, I was aghast that so many of them were committing these costly sins of mismanagement and miscommunication, without even realizing it. If I can stop even one more firm from shooting its own foot, then this is worth it.

| Jan 22, 2014
SOM-designed University Center uses 'sky quads,' stacked staircases to promote chance encounters
The New School's vertical campus in Manhattan houses multiple functions, including labs, design studios, a library, and student residences, in a 16-story building.

| Jan 22, 2014
Architecture Billings Index sees first back-to-back decline since mid-2012
The AIA's Architecture Billings Index dipped for the second consecutive month in December—the first consecutive months of contraction since May and June of 2012.

| Jan 21, 2014
Comcast to build second Philadelphia skyscraper, with Norman Foster-designed tower [slideshow]
The British architect last week unveiled his scheme for the $1.2 billion, 59-story Comcast Innovation and Technology Center, planned adjacent to the Comcast Center.


