


The U.S. Energy Information Administration has posted preliminary results from its periodic Commercial Buildings Energy Consumption survey. Data for the project were collected in 2012 and detailed analyses of energy consumption will be released beginning next spring. The project includes buildings >1,000 sf that devote more than half of their floorspace to activity that is not residential, manufacturing, industrial, or agricultural.
The preliminary results from the Commercial Buildings Energy Consumption Survey (CBECS) show that there were 5.6 million commercial buildings in the United States in 2012, comprising 87.4 billion square feet of floorspace. This represents a 14% increase in the number of buildings and a 22% increase in floorspace since 2003, the last year for which CBECS results are available.
The preliminary data can be found in this summary table of building counts and total square footage by building size category, principal building activity, year of construction category, Census region, and Census division. The first tab provides the estimates; the second tab on the table provides relative standard errors (RSEs) for the estimates.
For comparison, there is a similar summary table from the 2003 CBECS. Other file formats for the same table can be accessed from the 2003 CBECS data page.
The size, use, vintage, and geographic region of a building are among the key determinants that influence its energy use. Subsequent releases will show more detailed characteristics and crosstabulations among key categories. This is the first release of many reports and data releases expected for the 2012 CBECS; these preliminary tables provide a first look at the building stock and the attributes that drive commercial energy use.
Trends – 1979 to 2012: Growth in building size outpaces increases in building stock
Since the first CBECS was conducted in 1979 to the current 2012 CBECS, the number of buildings has increased from 3.8 million to 5.6 million, and the amount of commercial floorspace has increased from 51 billion to 87 billion square feet.

HOW DOES EIA PRODUCE RELIABLE RESULTS FROM A SAMPLE SURVEY?
The CBECS is a national sample survey. See How Were Buildings Selected for the 2012 CBECS? for an overview of the sampling process. After the sample was selected, preparations for the interviewing phase began. In April 2013, about 250 field interviewers were trained to visit buildings across the United States and recruit respondents knowledgeable about energy use in the buildings. After recruiting a respondent at a building, the field interviewer’s job was to conduct an interview on a laptop computer asking questions about the building’s structure, use, energy equipment, and energy use. Between April and November 2013, interviews were conducted in-person or by telephone at over 6,500 buildings nationwide. Because every building had a chance to be selected and that chance is known, a sample weight can be assigned to each case. The resulting dataset is representative of the entire U.S. commercial building population.
Principal building activities: The most prevalent building types account for the majority of the total buildings and floorspace, while the building types with the largest average buildings are less common in the building stock
The commercial building sector is characterized by diversity. The 2012 survey identified more than 100 subcategories of building activity, which are aggregated into the 14 principal building activities shown in the summary table and in the figures below. CBECS includes buildings as small and singular in activity as a freestanding bank or fast food restaurant, to buildings as large and complex as an office building with hundreds of tenants or a major airport terminal. CBECS also includes vacant buildings; some vacant buildings use energy, either for maintenance purposes or because a small amount of space is still used in the building1.

Among the general building activities, lodging, education, and health care are the largest buildings, on average. The health care category's average is greatly affected by the size of inpatient health care buildings (i.e., hospitals), which have an average size of 247,700 square feet per building, compared to outpatient health care buildings, which have an average size of 12,100 square feet.

Figure 4 tracks changes in the building stock over the past 10 years by comparing the number of buildings for each principal building activity from 2003 to 2012. The highest percent of growth was in vacant buildings and other types of buildings, which includes buildings such as airplane hangars, laboratories and data centers. Warehouses, food service buildings, public assembly, and office buildings also increased between 2003 and 2012, while food sales buildings (e.g., grocery and convenience stores) showed a decrease,2 and mercantile (retail and malls) showed a decrease, although it is not statistically significant. Because CBECS is a sample survey, each estimate has sampling error associated with it, which should be considered when comparing estimates. See What is an RSE? and Estimation of Standard Errors for more information.

Size of buildings: Although there are relatively few very large buildings (over 100,000 square feet of floorspace), they account for more than one-third of total commercial building floorspace
Commercial buildings are often depicted showing a skyline of towering buildings. However, the vast majority of commercial buildings are relatively small. Just less than half of buildings are 5,000 square feet in size or smaller, and nearly three-fourths are 10,000 square feet or smaller. The median building size is 5,100 square feet (i.e., half the buildings are larger than this and half are smaller), while the average size is 15,700 square feet. The average is larger than the median because of the influence of a small number of very large buildings; buildings over 100,000 square feet make up only about 2% of the building count but about 35% of the total floorspace.

Year constructed: The commercial building stock is middle-aged, and newer buildings are larger than older ones
Commercial buildings remain in use for many decades. Although about 12% of commercial buildings (comprising 14% of commercial floorspace) were built in the past 10 years, the commercial building stock is still fairly old, with about half of all buildings constructed at least 35 years ago. However, in the existing building stock, there are more buildings built in the 2000s than buildings built prior to 1946.

Newer buildings tend to be larger than older buildings. The average building size for those constructed before 1960 is 12,000 square feet; buildings constructed between 1960 and 1999 average 16,300 square feet; and buildings constructed in the 2000s average 19,100 square feet. The differences between these average building sizes are statistically significant.

Census region and division (see map): The South has the most commercial buildings, but the Northeast has the largest commercial buildings
The South Census region, the most populous of the four Census regions, has the largest percentage of commercial buildings and commercial floorspace, with about 40% of both total buildings and floorspace. The Midwest and West regions each account for more than one-fifth of commercial buildings and floorspace.

Buildings in the Northeast region are, on average, 4,000 to 5,000 square feet larger than buildings in the other regions. The Northeast region includes the Middle Atlantic division (New York, Pennsylvania, and New Jersey), where buildings average 22,400 square feet.

Footnote
1 CBECS principal building activity is defined as the activity occupying the most floorspace. Respondents are first asked if there is one activity that occupies 75% or more of the floorspace. If not, CBECS collects the top three building activities and their corresponding percents and the principal activity is assigned as the one comprising the most floorspace.
2 Estimates for number of food sales buildings can be somewhat misleading because grocery stores and convenience stores are often part of strip malls and therefore included in the "Enclosed and strip malls" category in CBECS. "Enclosed and strip malls" is a subcategory of "Mercantile" and is shown in the summary table.
Specific questions on this product may be directed to Joelle Michaels.
Related Stories
Luxury Residential | Jan 30, 2024
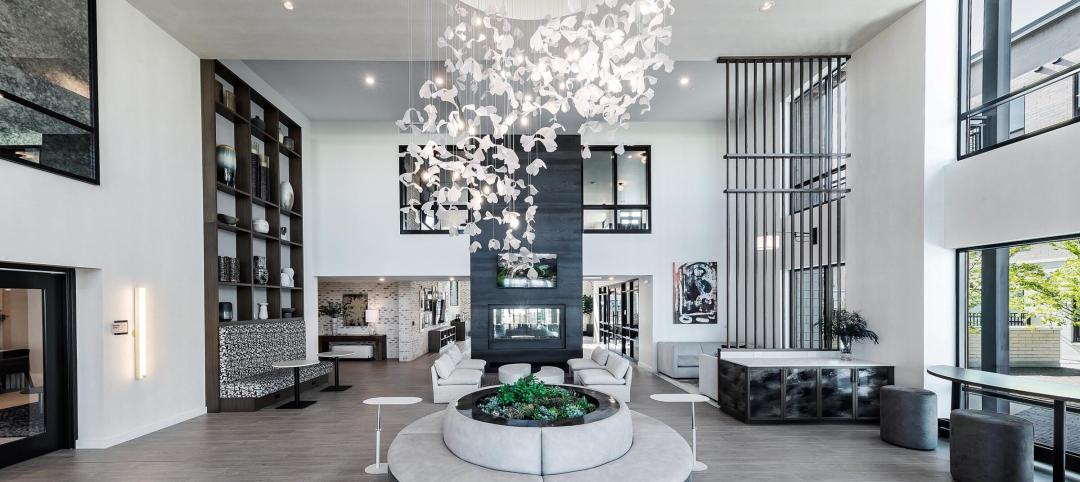
Lumen Fox Valley mall-to-apartments conversion completes interiors
Architecture and interior design firm Morgante Wilson Architects (MWA) today released photos of its completed interiors work at Lumen Fox Valley, a 304-unit luxury rental community and mall-to-apartments conversion.

Airports | Jan 30, 2024
Rafael Viñoly Architects’ design for the new Florence, Italy, airport terminal will feature a rooftop vineyard
At Florence, Italy’s Aeroporto Amerigo Vespucci, the new international airport terminal will feature a fully operating vineyard on the facility’s rooftop. Designed by Rafael Viñoly Architects, the terminal is expected to see over 5.9 million passengers annually. Renderings for the project have recently been released.

Giants 400 | Jan 29, 2024
Top 160 Workplace Interior Architecture Firms for 2023
Gensler, Interior Architects, HOK, SmithGroup, and Perkins&Will top BD+C's ranking of the nation's largest workplace interior and interior fitout architecture and architecture engineering (AE) firms for 2023, as reported in the 2023 Giants 400 Report.

Mixed-Use | Jan 29, 2024
12 U.S. markets where entertainment districts are under consideration or construction
The Pomp, a 223-acre district located 10 miles north of Fort Lauderdale, Fla., and The Armory, a 225,000-sf dining and entertainment venue on six acres in St Louis, are among the top entertainment districts in the works across the U.S.

Laboratories | Jan 25, 2024
Tactical issues for renovating university research buildings
Matthew Plecity, AIA, ASLA, Principal, GBBN, highlights the connection between the built environment and laboratory research, and weighs the benefits of renovation vs. new construction.
K-12 Schools | Jan 25, 2024
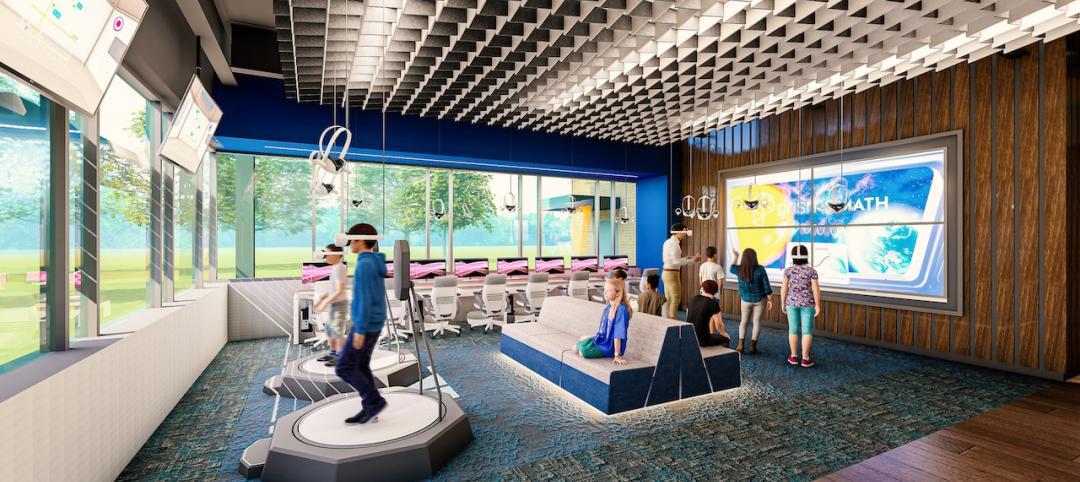
Video: Research-based design for K-12 schools
Two experts from national architecture firm PBK discuss how behavioral research is benefiting the design of K-12 schools in Texas, Florida, and other states. Dan Boggio, AIA, LEED AP, NCARB, Founder & Executive Chair, PBK, and Melissa Turnbaugh, AIA, NCARB, Partner & National Education & Innovation Leader, PBK, speak with Robert Cassidy, Executive Editor, Building Design+Construction.

Women in Design+Construction | Jan 25, 2024
40 Under 40 Class of 2023 winner Kimberly Dowdell inaugurated as AIA 2024 President
The American Institute of Architects (AIA) has announced the inauguration of Kimberly Dowdell, AIA, NOMAC, NCARB, LEED AP BD+C, Principal and Director of Strategic Relationships at HOK and BD+C 40 Under 40 superstar, as its 100th president.
Senior Living Design | Jan 24, 2024
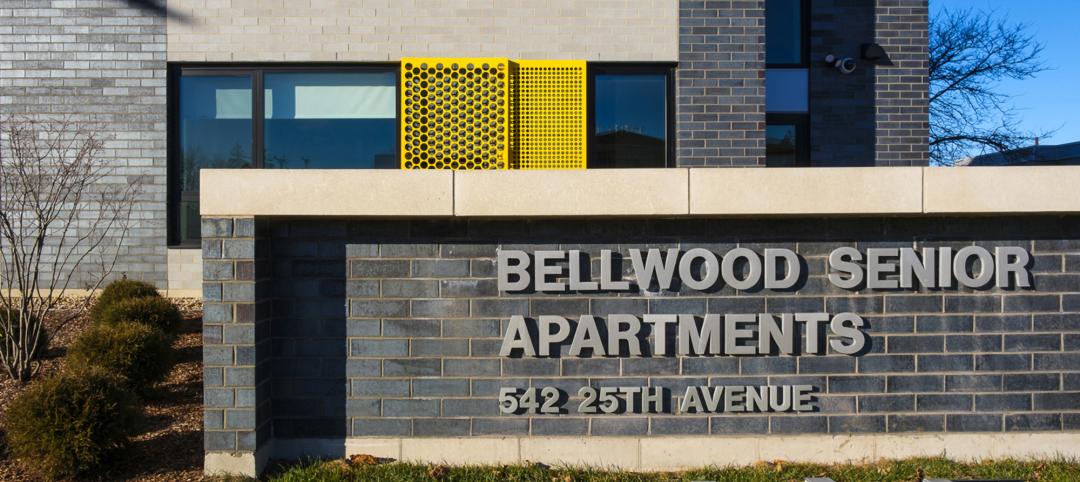
Former Walgreens becomes affordable senior living community
Evergreen Real Estate Group has announced the completion of Bellwood Senior Apartments. The 80-unit senior living community at 542 25th Ave. in Bellwood, Ill., provides independent living options for low-income seniors.

AEC Tech | Jan 24, 2024
4 ways AEC firms can benefit from digital transformation
While going digital might seem like a playground solely for industry giants, the truth is that any company can benefit from the power of technology.

Giants 400 | Jan 23, 2024
Top 60 Parking Structure Architecture Firms for 2023
Choate Parking Consultants, Page Southerland Page, Gensler, AO, and Elkus Manfredi Architects top BD+C's ranking of the nation's largest parking structure architecture and architecture engineering (AE) firms for 2023, as reported in the 2023 Giants 400 Report.


