According to a new report published by the U.S. Census, 35.9 million people (not counting children younger than one year) moved between 2012 and 2013, meaning that 11.7% of the population moved in one year. The report seeks to examine who moved where and why, and to analyze the larger implications of that data.
Forty-eight percent of those who moved listed housing reasons. For example, they wanted a better home or apartment, they sought to own a home rather than renting, or they wanted cheaper housing. Thirty percent moved for family-related reasons, and 19% moved for their jobs.
The report finds that there were many similarities in reasoning for movers between this report and the last comparable one in 1999. The three top reasons for moving have remained the same: “wanted new or better home/apartment,” “other housing reason,” and “other family reason.”
Here are some highlights of the report that we found interesting:
• Respondents with higher levels of education were more likely to move for job-related reasons
• Intracounty moves were usually housing related, while intercounty and longer distance moves tended to be job related
• More women moved than men; the Census Bureau speculates that "a plausible explanation for this difference is that there are more females in the population universe…females composed a greater percentage of the population universe than males with 51.1%."
• A greater amount of males moved for job-related reasons than did females
• Married respondents were the least likely to move for family-related reasons
• African-American respondents reported housing-related reasons for moving at the highest rate of any race
• The mover rate has declined overall in the past fifteen years, dropping from 15.9% in 1998-1999 to 11.7% in 2012-2013
Related Stories
Codes and Standards | Sep 9, 2019
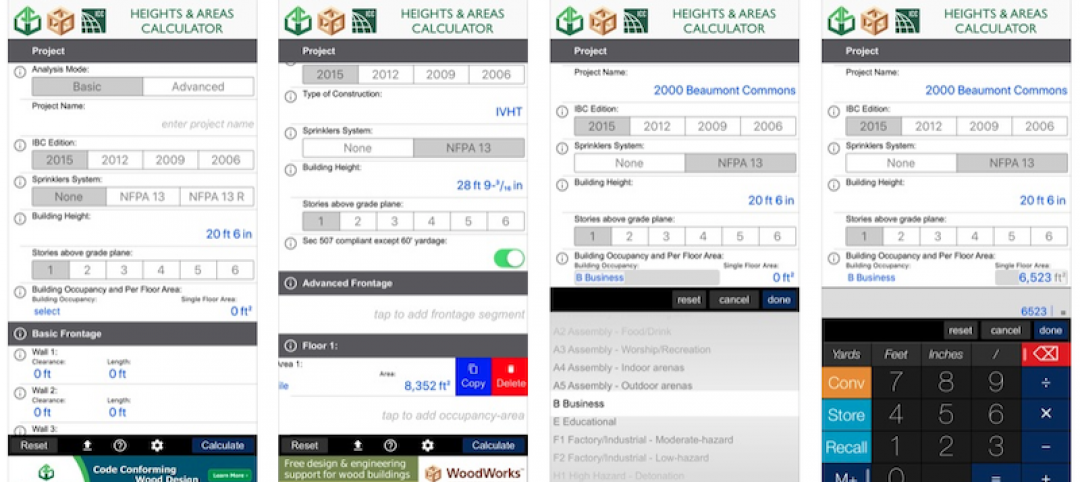
Free app calculates maximum allowable heights and areas for buildings
A free app that calculates the maximum allowable heights and areas for buildings of various occupancy classifications and types of construction has been released.
Retail Centers | Sep 6, 2019
Another well-known retailer files for bankruptcy: Here's the solution to more empty anchor stores
Where can you find the future of retail? At the intersection of experience and instant gratification.
Giants 400 | Sep 5, 2019
Top 110 Hotel Sector Architecture Firms for 2019
Gensler, WATG, HKS, HBG Design, and Steelman Partners top the rankings of the nation's largest hotel sector architecture and architecture engineering (AE) firms, as reported in Building Design+Construction's 2019 Giants 300 Report.
Architects | Sep 5, 2019
AIA launches landmark initiative to drive climate action
AIA Board of Directors approves member-led resolution to rally architects in mitigating and adapting the built environment.
Giants 400 | Sep 3, 2019
Top 140 K-12 School Sector Architecture Firms for 2019
DLR Group, PBK, Huckabee, Stantec, and VLK Architects top the rankings of the nation's largest K-12 school sector architecture and architecture engineering (AE) firms, as reported in Building Design+Construction's 2019 Giants 300 Report.
Market Data | Sep 3, 2019
Nonresidential construction spending slips in July 2019, but still surpasses $776 billion
Construction spending declined 0.3% in July, totaling $776 billion on a seasonally adjusted annualized basis.
Giants 400 | Aug 30, 2019
2019 K-12 School Giants Report: 360-degree learning among top school design trends for 2019
K-12 school districts are emphasizing practical, hands-on experience and personalized learning.
Giants 400 | Aug 28, 2019
Top 35 Data Center Architecture Firms for 2019
Corgan, HDR, Gensler, AECOM, and Page top the rankings of the nation's largest data center sector architecture and architecture engineering (AE) firms, as reported in Building Design+Construction's 2019 Giants 300 Report.
AEC Innovators | Aug 27, 2019
7 AEC industry disruptors and their groundbreaking achievements
From building prefab factories in the sky to incubating the next generation of AEC tech startups, our 2019 class of AEC Innovators demonstrates that the industry is poised for a shakeup. Meet BD+C’s 2019 AEC Innovators.
Giants 400 | Aug 16, 2019
2019 Healthcare Giants Report: The ‘smart hospital’ is on the horizon
These buildings perform functions like a medical practitioner. This and more healthcare sector trends from Building Design+Construction's 2019 Giants 300 Report.


