


Lodging Econometrics (LE) recently released the Global Construction Pipeline Trend Report, which compiles the construction pipeline for every country and market in the world. Currently, the top world regions by project count are North America with 5,239 Projects/639,712 Rooms, Asia Pacific with 4,233 Projects/903,415 Rooms and EMEA with 2,100 Projects/395,506 Rooms.
The top countries by project-count are the United States with 5,011 Projects/608,837 Rooms and China with 2,435 Projects/538,836 Rooms. The U.S. accounts for 40% of the projects in the Global Pipeline while China accounts for 20%, resulting in 60% of the Global Pipeline being concentrated in just two countries.
The cities with the largest pipeline project count are: New York with 181 Projects/30,225 Rooms, Houston with 148 Projects/16,398 Rooms, Dubai with 145 Projects/40,733 Rooms, Dallas with 143 Projects/17,580 Rooms and Seoul 126 Projects/22,199 Rooms.
Related Stories
Market Data | May 12, 2020
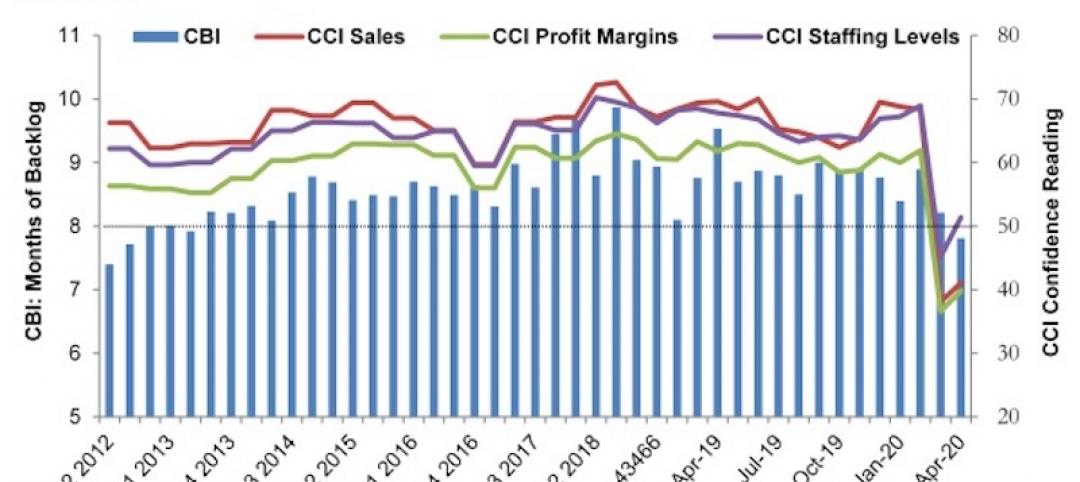
ABC’s Construction Backlog Indicator falls in April; Contractor Confidence rebounds from historic lows
Nonresidential construction backlog is down 0.4 months compared to the March 2020 ABC survey and 1.7 months from April 2019.

Market Data | May 12, 2020
6 must reads for the AEC industry today: May 12, 2020
A 13-point plan to reduce coronavirus deaths in nursing homes and Bjarke Ingels discusses building on Mars.

Market Data | May 11, 2020
Interest in eSports is booming amid COVID-19
The industry has proved largely immune to the COVID-19 pandemic due to its prompt transition into online formats and sudden spike in interest from traditional sports organizations.

Market Data | May 11, 2020
6 must reads for the AEC industry today: May 11, 2020
Nashville residential tower will rise 416 feet and the construction industry loses 975,000 jobs.

Market Data | May 8, 2020
Construction industry loses 975,000 jobs in April as new association survey shows deteriorating demand for construction projects
Association partner Procore also releases near real-time construction data measuring impacts of coronavirus as association calls for new measures.

Market Data | May 8, 2020
7 must reads for the AEC industry today: May 8, 2020
The death of the office and Colorado's first multifamily project to receive WELL Precertification.

Market Data | May 7, 2020
5 must reads for the AEC industry today: May 7, 2020
5 memory care communities with a strong sense of mission and making jobsites safer in the COVID-19 world.

Market Data | May 6, 2020
6 must reads for the AEC industry today: May 6, 2020
5 questions engineers will ask after COVID-19 and coronavirus threatens push for denser housing.

Market Data | May 5, 2020
5 must reads for the AEC industry today: May 5, 2020
A new temporary hospital pops up in N.J., and apartment firms' reactivation plans begin to take shape.

Market Data | May 4, 2020
6 must reads for the AEC industry today: May 4, 2020
How working from home is influencing design and is this the end of the open office?


