


Step aside New York and L.A., The Atlantic’s CityLab finds that not all design jobs have these two trendy hotspots as their epicenters.
CityLab Editor at Large Richard Florida worked together with occupational data provided by the labor market data and research firm EMSI to identify geographic clusters of the design sector – architects and landscape architects; commercial and industrial designers, graphic designers, fashion designers, interior designer, and others. His analysis included both designers working for firms and self-employed freelancers.
Around 625,000 Americans are employed in the design sector, a decline of about 12,000 since the Great Recession.
The analyst zoomed into specific metro areas (those with more than a million people) and mapped out the number of workers in the design sector, median wages and regional share of designers for the largest 51 U.S. metros.
Florida developed a stat named the location quotient (LQ), which measures the concentration of a given occupation in a metro area to its concentration across the country. Hence, an LQ of 1 indicates the occupation’s share matches the national average, an LQ of 2 is double that, and so on.
Though the concentration of fashion designers expectedly falls on New York first and L.A. second, Florida’s findings indicate four clusters of design fields concentrated in a city other than those two, and here they are:
Detroit – Commercial and Industrial Designers

Commercial and industrial designers that design manufactured products like cars, toys and appliances are centered in the rust belt, with Detroit’s LQ leading at 5.7.
Seattle – Architects

With an LQ of 2.42, Seattle was far above New York, which came in tenth, and Los Angeles, which came in twentieth.
Minneapolis – Graphic Designers

The Twin Cities tops the list of graphic designers with an LQ of 1.7., which Florida thinks is “driven by its long-standing strength as a center for marketing and advertising.”
San Francisco – Self-employed Designers

It’s only natural that San Francisco, the hub of start-ups, would also invite a lot of independent, self-employed designers of all fields. With an LQ of 2.06, the City by the Bay is ahead of Los Angeles and New York, with tech hubs San Jose, San Diego and Austin between them.
Visit CityLab to learn more and view maps of the United States with bubbles showing the concentration of workers in the design sector.
Related Stories
Office Buildings | Aug 1, 2023
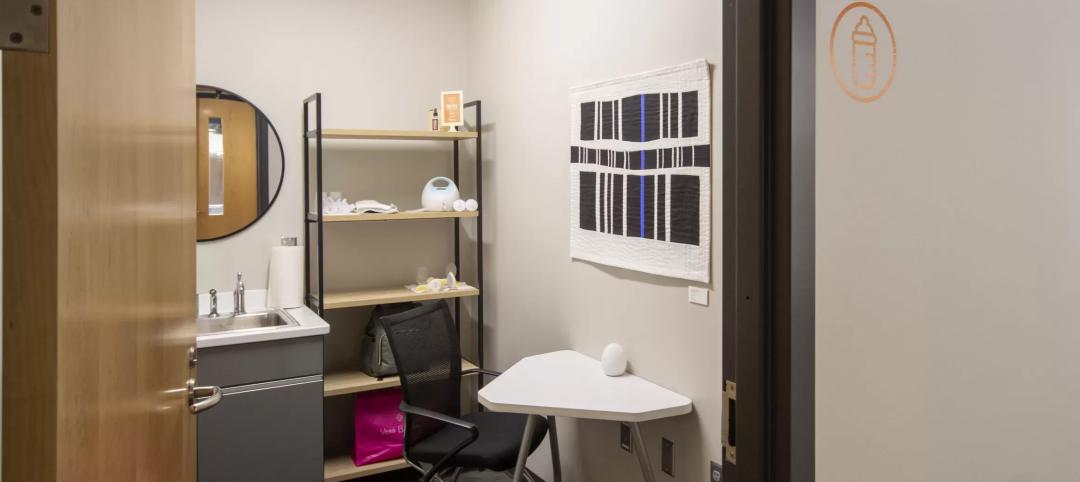
Creating a nurturing environment: The value of a mother’s room in the workplace
Since becoming an architect, Rebecca Martin of Design Collaborative has drawn a mother’s room into numerous projects. But it wasn't until she became a mom that she fully appreciated their importance in the workspace.

Digital Twin | Jul 31, 2023
Creating the foundation for a Digital Twin
Aligning the BIM model with the owner’s asset management system is the crucial first step in creating a Digital Twin. By following these guidelines, organizations can harness the power of Digital Twins to optimize facility management, maintenance planning, and decision-making throughout the building’s lifecycle.

K-12 Schools | Jul 31, 2023
Austin’s new Rosedale School serves students with special needs aged 3 to 22
In Austin, the Rosedale School has opened for students with special needs aged 3 to 22. The new facility features sensory rooms, fully accessible playgrounds and gardens, community meeting spaces, and an on-site clinic. The school serves 100 learners with special needs from across Austin Independent School District (ISD).

MFPRO+ New Projects | Jul 27, 2023
OMA, Beyer Blinder Belle design a pair of sculptural residential towers in Brooklyn
Eagle + West, composed of two sculptural residential towers with complementary shapes, have added 745 rental units to a post-industrial waterfront in Brooklyn, N.Y. Rising from a mixed-use podium on an expansive site, the towers include luxury penthouses on the top floors, numerous market rate rental units, and 30% of units designated for affordable housing.

Affordable Housing | Jul 27, 2023
Houston to soon have 50 new residential units for youth leaving foster care
Houston will soon have 50 new residential units for youth leaving the foster care system and entering adulthood. The Houston Alumni and Youth (HAY) Center has broken ground on its 59,000-sf campus, with completion expected by July 2024. The HAY Center is a nonprofit program of Harris County Resources for Children and Adults and for foster youth ages 14-25 transitioning to adulthood in the Houston community.

Hotel Facilities | Jul 27, 2023
U.S. hotel construction pipeline remains steady with 5,572 projects in the works
The hotel construction pipeline grew incrementally in Q2 2023 as developers and franchise companies push through short-term challenges while envisioning long-term prospects, according to Lodging Econometrics.

Sustainability | Jul 27, 2023
USGBC warns against building energy code preemptions, rollbacks
In a recent editorial, the USGBC cited a growing number of U.S. state legislators who are “aiming to roll back building energy code standards and/or preempt local governments from advancing energy-efficient building codes.”

Resiliency | Jul 27, 2023
'Underground climate change' can damage building foundations, civil infrastructure
A phenomenon known as “underground climate change” can lead to damage of building foundations and civil infrastructure, according to a researcher at Northwestern University. When the ground gets hotter, it can expand and contract, causing foundations to move and sometimes crack.

Adaptive Reuse | Jul 27, 2023
Number of U.S. adaptive reuse projects jumps to 122,000 from 77,000
The number of adaptive reuse projects in the pipeline grew to a record 122,000 in 2023 from 77,000 registered last year, according to RentCafe’s annual Adaptive Reuse Report. Of the 122,000 apartments currently undergoing conversion, 45,000 are the result of office repurposing, representing 37% of the total, followed by hotels (23% of future projects).

Hotel Facilities | Jul 26, 2023
Hospitality building construction costs for 2023
Data from Gordian breaks down the average cost per square foot for 15-story hotels, restaurants, fast food restaurants, and movie theaters across 10 U.S. cities: Boston, Chicago, Las Vegas, Los Angeles, Miami, New Orleans, New York, Phoenix, Seattle, and Washington, D.C.


