


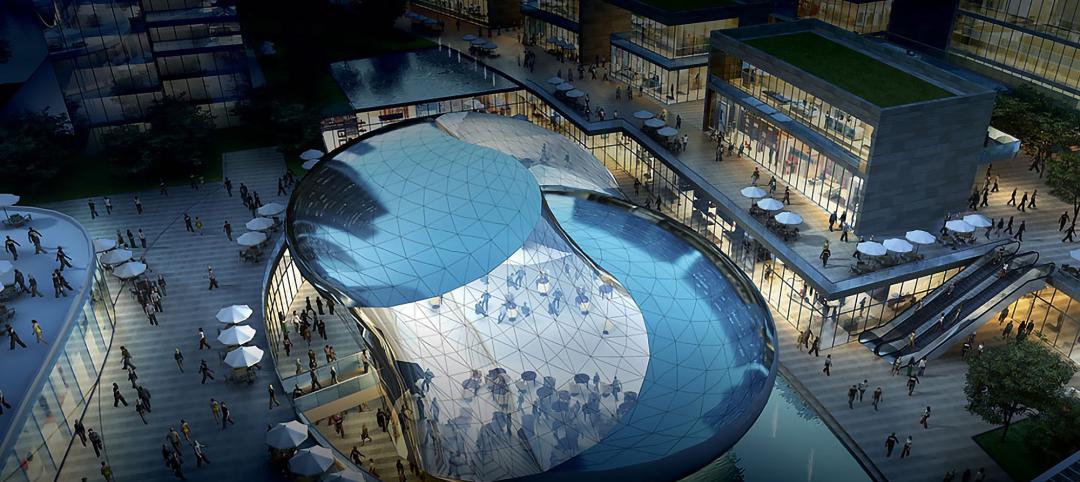
Step aside New York and L.A., The Atlantic’s CityLab finds that not all design jobs have these two trendy hotspots as their epicenters.
CityLab Editor at Large Richard Florida worked together with occupational data provided by the labor market data and research firm EMSI to identify geographic clusters of the design sector – architects and landscape architects; commercial and industrial designers, graphic designers, fashion designers, interior designer, and others. His analysis included both designers working for firms and self-employed freelancers.
Around 625,000 Americans are employed in the design sector, a decline of about 12,000 since the Great Recession.
The analyst zoomed into specific metro areas (those with more than a million people) and mapped out the number of workers in the design sector, median wages and regional share of designers for the largest 51 U.S. metros.
Florida developed a stat named the location quotient (LQ), which measures the concentration of a given occupation in a metro area to its concentration across the country. Hence, an LQ of 1 indicates the occupation’s share matches the national average, an LQ of 2 is double that, and so on.
Though the concentration of fashion designers expectedly falls on New York first and L.A. second, Florida’s findings indicate four clusters of design fields concentrated in a city other than those two, and here they are:
Detroit – Commercial and Industrial Designers

Commercial and industrial designers that design manufactured products like cars, toys and appliances are centered in the rust belt, with Detroit’s LQ leading at 5.7.
Seattle – Architects

With an LQ of 2.42, Seattle was far above New York, which came in tenth, and Los Angeles, which came in twentieth.
Minneapolis – Graphic Designers

The Twin Cities tops the list of graphic designers with an LQ of 1.7., which Florida thinks is “driven by its long-standing strength as a center for marketing and advertising.”
San Francisco – Self-employed Designers

It’s only natural that San Francisco, the hub of start-ups, would also invite a lot of independent, self-employed designers of all fields. With an LQ of 2.06, the City by the Bay is ahead of Los Angeles and New York, with tech hubs San Jose, San Diego and Austin between them.
Visit CityLab to learn more and view maps of the United States with bubbles showing the concentration of workers in the design sector.
Related Stories

Healthcare Facilities | Dec 19, 2023
A new hospital in Duluth, Minn., is now the region’s largest healthcare facility
In Duluth, Minn., the new St. Mary’s Medical Center, designed by EwingCole, is now the largest healthcare facility in the region. The hospital consolidates Essentia Health’s healthcare services under one roof. At about 1 million sf spanning two city blocks, St. Mary’s overlooks Lake Superior, providing views on almost every floor of the world’s largest freshwater lake.

Government Buildings | Dec 19, 2023
New Pennsylvania State Archives building holds documents dating back to 1680
Work was recently completed on a new Pennsylvania State Archives building in Harrisburg, Penn. The HGA-designed, 146,000-sf facility offers numerous amenities, including computers, scanners, printers, a kitchenette with seating, lockers, a meeting room, a classroom, an interactive video wall, gallery, and all-gender restrooms. The features are all intended to provide a welcoming and comfortable environment for visitors.
Urban Planning | Dec 18, 2023
The impacts of affordability, remote work, and personal safety on urban life
Data from Gensler's City Pulse Survey shows that although people are satisfied with their city's experience, it may not be enough.

MFPRO+ News | Dec 18, 2023
Berkeley, Calif., raises building height limits in downtown area
Facing a severe housing shortage, the City of Berkeley, Calif., increased the height limits on residential buildings to 12 stories in the area close to the University of California campus.

Green | Dec 18, 2023
Class B commercial properties gain more from LEED certification than Class A buildings
Class B office properties that are LEED certified command a greater relative benefit than LEED-certified Class A buildings, according to analysis from CBRE. The Class B LEED rent advantage over non-LEED is about three times larger than the premium earned by Class A LEED buildings.

Codes and Standards | Dec 18, 2023
ASHRAE releases guide on grid interactivity in the decarbonization process
A guide focusing on the critical role of grid interactivity in building decarbonization was recently published by ASHRAE. The Grid-Interactive Buildings for Decarbonization: Design and Operation Resource Guide provides information on maximizing carbon reduction through buildings’ interaction with the electric power grid.

Architects | Dec 18, 2023
Perkins&Will’s new PRECEDE tool provides access to public health data to inform design decisions
Perkins&Will recently launched a free digital resource that allows architects and designers to access key public health data to inform design decisions. The “Public Repository to Engage Community and Enhance Design Equity,” or PRECEDE, centralizes demographic, environmental, and health data from across the U.S. into a geospatial database.

Sports and Recreational Facilities | Dec 15, 2023
San Antonio Spurs’ new practice facility aims to help players win championships and maintain well-being
Designed by ZGF, the Victory Capital Performance Center uses biophilic design to promote better health and wellness on and off the court.
Affordable Housing | Dec 14, 2023
What's next for affordable housing in 2024?
As 2023 draws to a close, GBBN’s Mary Jo Minerich and Amanda Markovic, AIA sat down to talk about the future. What’s next in terms of trends, technology, and construction of affordable housing?

75 Top Building Products | Dec 13, 2023
75 top building products for 2023
From a bladeless rooftop wind energy system, to a troffer light fixture with built-in continuous visible light disinfection, innovation is plentiful in Building Design+Construction's annual 75 Top Products report.


