


Step aside New York and L.A., The Atlantic’s CityLab finds that not all design jobs have these two trendy hotspots as their epicenters.
CityLab Editor at Large Richard Florida worked together with occupational data provided by the labor market data and research firm EMSI to identify geographic clusters of the design sector – architects and landscape architects; commercial and industrial designers, graphic designers, fashion designers, interior designer, and others. His analysis included both designers working for firms and self-employed freelancers.
Around 625,000 Americans are employed in the design sector, a decline of about 12,000 since the Great Recession.
The analyst zoomed into specific metro areas (those with more than a million people) and mapped out the number of workers in the design sector, median wages and regional share of designers for the largest 51 U.S. metros.
Florida developed a stat named the location quotient (LQ), which measures the concentration of a given occupation in a metro area to its concentration across the country. Hence, an LQ of 1 indicates the occupation’s share matches the national average, an LQ of 2 is double that, and so on.
Though the concentration of fashion designers expectedly falls on New York first and L.A. second, Florida’s findings indicate four clusters of design fields concentrated in a city other than those two, and here they are:
Detroit – Commercial and Industrial Designers

Commercial and industrial designers that design manufactured products like cars, toys and appliances are centered in the rust belt, with Detroit’s LQ leading at 5.7.
Seattle – Architects

With an LQ of 2.42, Seattle was far above New York, which came in tenth, and Los Angeles, which came in twentieth.
Minneapolis – Graphic Designers

The Twin Cities tops the list of graphic designers with an LQ of 1.7., which Florida thinks is “driven by its long-standing strength as a center for marketing and advertising.”
San Francisco – Self-employed Designers

It’s only natural that San Francisco, the hub of start-ups, would also invite a lot of independent, self-employed designers of all fields. With an LQ of 2.06, the City by the Bay is ahead of Los Angeles and New York, with tech hubs San Jose, San Diego and Austin between them.
Visit CityLab to learn more and view maps of the United States with bubbles showing the concentration of workers in the design sector.
Related Stories

Giants 400 | Aug 28, 2020
2020 Giants 400 Report: Ranking the nation's largest architecture, engineering, and construction firms
The 2020 Giants 400 Report features more than 130 rankings across 25 building sectors and specialty categories.

Architects | Aug 27, 2020
Strategically planning your firm past the COVID-19 pandemic
As AEC firm leaders consider worst-case scenarios and explore possible solutions to surmount them, they learn to become nimble, quick, and ready to pivot as circumstances demand.

Digital Twin | Aug 27, 2020
The Weekly show: Digital twin technology and social equity in the AEC market
The August 27 episode of BD+C's "The Weekly" is available for viewing on demand.

Architects | Aug 26, 2020
We the People: Four steps for the architecture profession to build unity through design
Architect offers a 4-point manifesto to the design community to work for racial and social justice in the U.S. following the death of George Floyd.

Coronavirus | Aug 25, 2020
Video: 5 building sectors to watch amid COVID-19
RCLCO's Brad Hunter reveals the winners and non-winners of the U.S. real estate market during the coronavirus pandemic.
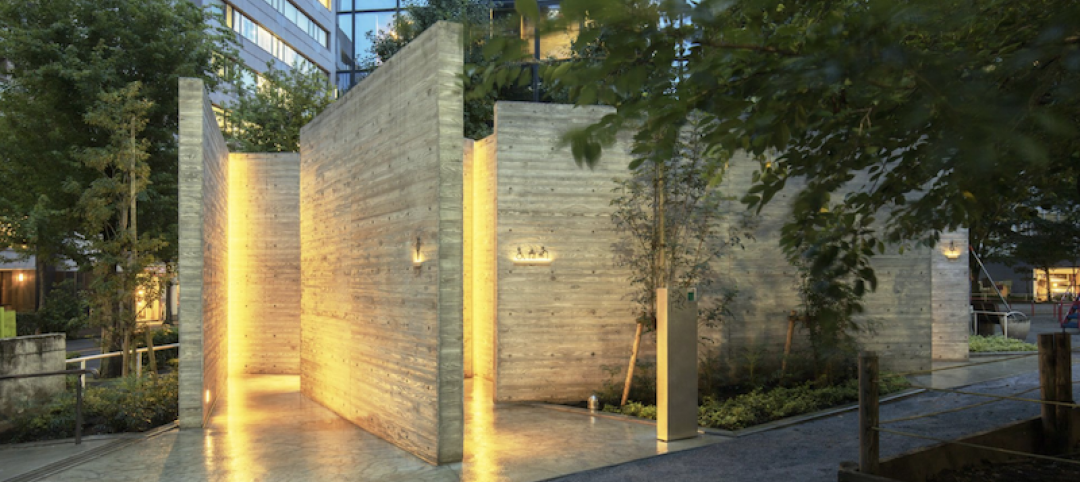
Architects | Aug 19, 2020
Japan’s Tokyo Toilet project looks to improve the perception of public restrooms
17 toilets throughout Shibuya will be redesigned as part of the project.
Architects | Aug 5, 2020
Final report: BD+C's 2020 Color Trends Report
This special research report from the editors of BD+C explores the leading trends and drivers related to the use of color on commercial, institutional, and multifamily building projects.

University Buildings | Aug 2, 2020
R&D hubs, modular-built hotels, and an award-winning student center on the August 6 “The Weekly”
R&D hubs, modular-built hotels, and an award-winning student center on the August 6 “The Weekly”

University Buildings | Jul 24, 2020
A hybrid learning approach could redefine higher education
Universities reassess current assets to determine growth strategies.

Coronavirus | Jun 19, 2020
Experts address COVID-19's impact on nursing homes and schools on The Weekly
The June 18 episode of BD+C's "The Weekly" is available for viewing on demand.


