


| TOP 110 RECONSTRUCTION CONSTRUCTION FIRMS | ||
| Rank | Firm | 2015 Revenue |
| 1 | Gilbane Building Co. | $2,127,487,000 |
| 2 | Turner Construction Co. | $1,931,117,760 |
| 3 | Whiting-Turner Contracting Co., The | $1,404,237,262 |
| 4 | PCL Construction Enterprises | $1,303,288,338 |
| 5 | Balfour Beatty US | $1,214,992,385 |
| 6 | Pepper Construction Group | $832,830,000 |
| 7 | JE Dunn Construction | $804,928,900 |
| 8 | Consigli Building Group | $777,521,827 |
| 9 | DPR Construction | $759,149,850 |
| 10 | Shawmut Design and Construction | $704,000,000 |
| 11 | HITT Contracting | $660,708,270 |
| 12 | Alberici-Flintco | $611,564,135 |
| 13 | Hensel Phelps | $584,000,000 |
| 14 | Skanska USA | $543,900,195 |
| 15 | Barton Malow Co. | $542,826,569 |
| 16 | Clune Construction Co. | $540,130,293 |
| 17 | Lendlease | $532,239,000 |
| 18 | James G. Davis Construction Corp. | $505,026,212 |
| 19 | Messer Construction Co. | $459,100,000 |
| 20 | Mortenson Construction | $432,420,000 |
| 21 | Jacobs | $416,783,478 |
| 22 | Hunter Roberts Construction Group | $415,628,056 |
| 23 | Suffolk Construction Co. | $400,316,800 |
| 24 | Swinerton Inc. | $349,000,000 |
| 25 | McCarthy Holdings | $348,539,998 |
| 26 | Robins & Morton | $339,995,669 |
| 27 | W.E. O’Neil Construction Co. | $336,766,707 |
| 28 | Beck Group, The | $316,027,821 |
| 29 | VCC | $314,301,994 |
| 30 | Clark Group | $292,819,953 |
| 31 | Walbridge | $283,000,000 |
| 32 | Manhattan Construction Group | $251,712,000 |
| 33 | JLL | $246,175,320 |
| 34 | Level 10 Construction | $245,837,117 |
| 35 | Ryan Companies US | $230,682,696 |
| 36 | Leopardo Companies | $230,143,280 |
| 37 | IMC Construction | $225,000,000 |
| 38 | LeChase Construction | $220,965,500 |
| 39 | Boldt Company, The | $195,086,494 |
| 40 | Choate Construction Co. | $177,722,187 |
| 41 | Burns & McDonnell | $176,706,584 |
| 42 | Brasfield & Gorrie | $172,054,584 |
| 43 | Walsh Group, The | $170,772,278 |
| 44 | C.W. Driver Companies | $169,062,549 |
| 45 | Kraus-Anderson | $167,000,000 |
| 46 | Webcor Builders | $160,239,209 |
| 47 | James McHugh Construction Co. | $155,175,264 |
| 48 | W.M. Jordan Company | $154,797,144 |
| 49 | Fortis Construction | $151,660,399 |
| 50 | Power Construction Co. | $147,000,000 |
| 51 | IPS | $141,876,000 |
| 52 | WSP | Parsons Brinckerhoff | $136,804,000 |
| 53 | Skender Construction | $129,444,691 |
| 54 | Plaza Construction | $125,000,000 |
| 55 | Sachse Construction | $124,029,492 |
| 56 | S. M. Wilson & Co. | $122,082,353 |
| 57 | Paric Corporation | $120,000,000 |
| 58 | Schimenti Construction Co. | $117,000,000 |
| 59 | Holder Construction Co. | $116,000,000 |
| 60 | Hill International | $113,000,000 |
| 61 | Bernards | $103,100,000 |
| 62 | CannonDesign | $102,600,000 |
| 63 | Benham Design | $102,458,168 |
| 64 | LPCiminelli | $102,318,611 |
| 65 | Dickinson Cameron Construction Co. | $100,000,000 |
| 66 | New South Construction Co. | $98,516,000 |
| 67 | Weis Builders | $94,504,000 |
| 68 | Hoar Construction | $94,116,000 |
| 69 | Andersen Construction | $92,000,000 |
| 70 | Coakley & Williams Construction | $85,742,698 |
| 71 | Cahill Contractors | $80,561,000 |
| 72 | Branch & Associates | $78,386,615 |
| 73 | Haskell | $76,987,448 |
| 74 | Wiss, Janney, Elstner Associates | $71,632,800 |
| 75 | Bette Companies, The | $65,269,832 |
| 76 | Shook Construction Co. | $62,518,301 |
| 77 | Dewberry | $60,223,172 |
| 78 | Harkins Builders | $60,000,000 |
| 79 | Hoffman Construction | $58,236,283 |
| 80 | Cumming | $56,485,000 |
| 81 | Hagerman Group, The | $53,000,000 |
| 82 | Haselden Construction | $52,585,703 |
| 83 | STV | $52,348,512 |
| 84 | Hill & Wilkinson General Contractors | $51,444,400 |
| 85 | Yates Companies, The | $50,000,000 |
| 86 | Corgan | $48,030,000 |
| 87 | KBE Building Corp. | $47,444,388 |
| 88 | Austin Industries | $45,169,521 |
| 89 | SSOE Group | $42,110,000 |
| 90 | Stalco Construction | $39,200,000 |
| 91 | Wendel | $38,909,581 |
| 92 | Core States Group | $36,805,648 |
| 93 | Millie and Severson Inc. | $30,650,873 |
| 94 | Ghafari Associates | $28,250,000 |
| 95 | Donohoe Construction Co. | $26,848,000 |
| 96 | Graham Construction | $25,600,000 |
| 97 | Lawrence Group | $25,248,000 |
| 98 | Batson-Cook Co. | $25,139,702 |
| 99 | CNY Group | $24,800,000 |
| 100 | Doster Construction Co. | $24,600,174 |
| 101 | HNTB Corporation | $23,475,887 |
| 102 | dck worldwide | $22,446,000 |
| 103 | SMMA | Symmes Maini & McKee Associates | $18,007,414 |
| 104 | KCI Technologies | $17,400,000 |
| 105 | BRPH | $13,880,239 |
| 106 | Juneau Construction Co. | $11,393,836 |
| 107 | Zak Companies | $9,904,091 |
| 108 | Morris Architects | $7,775,000 |
| 109 | Wick Fisher White | $6,111,000 |
| 110 | GreenbergFarrow | $5,808,935 |
| 111 | EMJ Corp. | $4,743,770 |
| 112 | Jordan Foster Construction | $4,416,000 |
| 113 | Inventure Design Group | $1,375,178 |
RETURN TO THE GIANTS 300 LANDING PAGE
Related Stories
| Nov 2, 2010
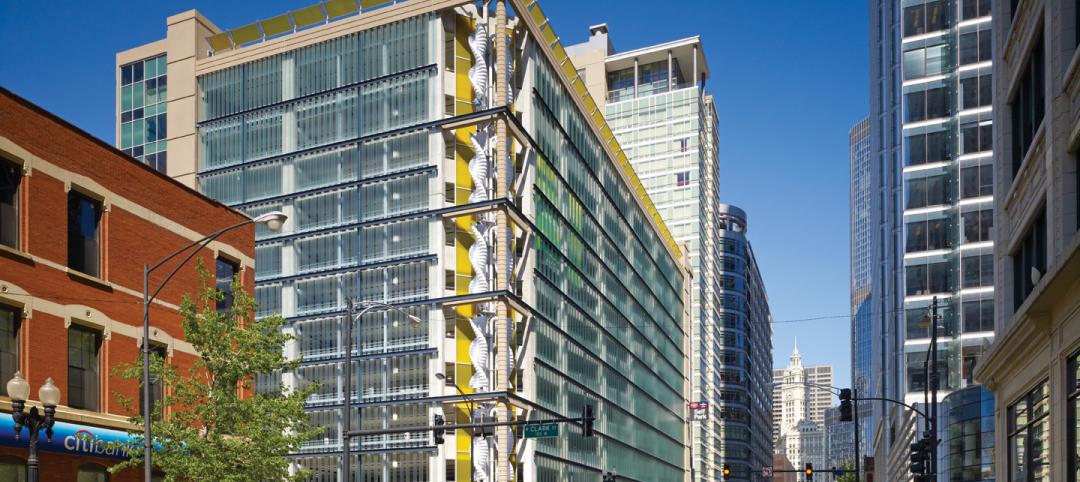
Wind Power, Windy City-style
Building-integrated wind turbines lend a futuristic look to a parking structure in Chicago’s trendy River North neighborhood. Only time will tell how much power the wind devices will generate.
| Nov 2, 2010
Energy Analysis No Longer a Luxury
Back in the halcyon days of 2006, energy analysis of building design and performance was a luxury. Sure, many forward-thinking AEC firms ran their designs through services such as Autodesk’s Green Building Studio and IES’s Virtual Environment, and some facility managers used Honeywell’s Energy Manager and other monitoring software. Today, however, knowing exactly how much energy your building will produce and use is survival of the fittest as energy costs and green design requirements demand precision.

| Nov 2, 2010
Yudelson: ‘If It Doesn’t Perform, It Can’t Be Green’
Jerry Yudelson, prolific author and veteran green building expert, challenges Building Teams to think big when it comes to controlling energy use and reducing carbon emissions in buildings.
| Nov 2, 2010
Historic changes to commercial building energy codes drive energy efficiency, emissions reductions
Revisions to the commercial section of the 2012 International Energy Conservation Code (IECC) represent the largest single-step efficiency increase in the history of the national, model energy. The changes mean that new and renovated buildings constructed in jurisdictions that follow the 2012 IECC will use 30% less energy than those built to current standards.
| Nov 1, 2010
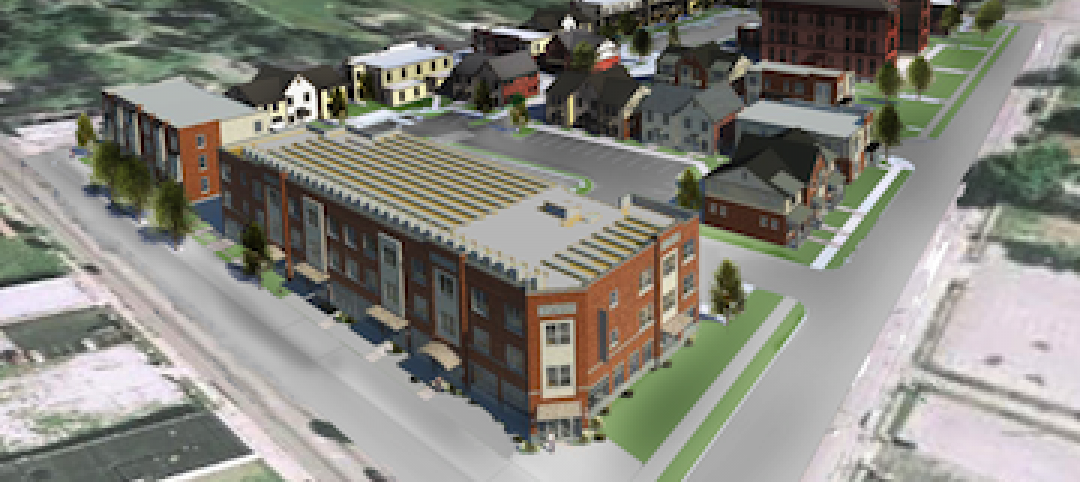
Sustainable, mixed-income housing to revitalize community
The $41 million Arlington Grove mixed-use development in St. Louis is viewed as a major step in revitalizing the community. Developed by McCormack Baron Salazar with KAI Design & Build (architect, MEP, GC), the project will add 112 new and renovated mixed-income rental units (market rate, low-income, and public housing) totaling 162,000 sf, plus 5,000 sf of commercial/retail space.

| Nov 1, 2010
John Pearce: First thing I tell designers: Do your homework!
John Pearce, FAIA, University Architect at Duke University, Durham, N.C., tells BD+C’s Robert Cassidy about the school’s construction plans and sustainability efforts, how to land work at Duke, and why he’s proceeding with caution when it comes to BIM.

| Nov 1, 2010
Vancouver’s former Olympic Village shoots for Gold
The first tenants of the Millennium Water development in Vancouver, B.C., were Olympic athletes competing in the 2010 Winter Games. Now the former Olympic Village, located on a 17-acre brownfield site, is being transformed into a residential neighborhood targeting LEED ND Gold. The buildings are expected to consume 30-70% less energy than comparable structures.

| Oct 27, 2010
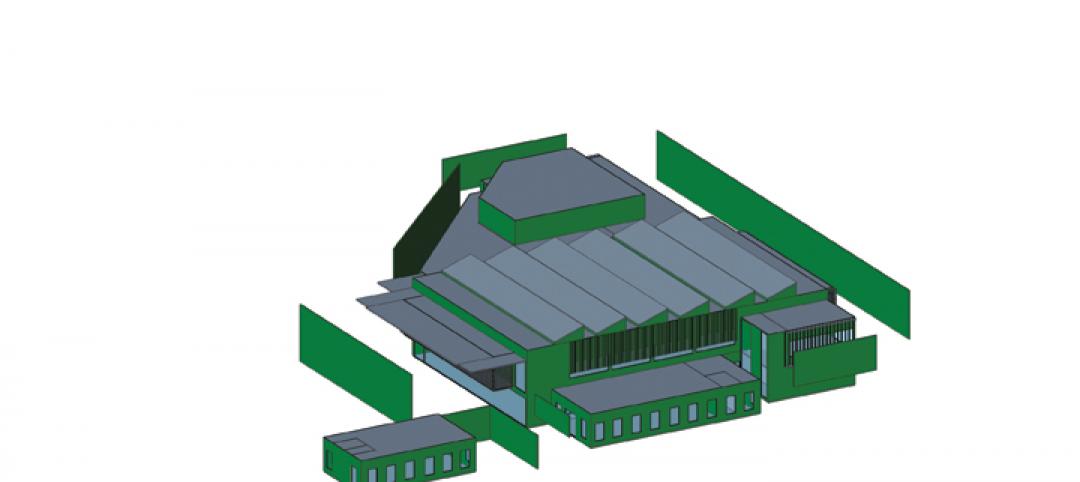
Grid-neutral education complex to serve students, community
MVE Institutional designed the Downtown Educational Complex in Oakland, Calif., to serve as an educational facility, community center, and grid-neutral green building. The 123,000-sf complex, now under construction on a 5.5-acre site in the city’s Lake Merritt neighborhood, will be built in two phases, the first expected to be completed in spring 2012 and the second in fall 2014.

| Oct 21, 2010
GSA confirms new LEED Gold requirement
The General Services Administration has increased its sustainability requirements and now mandates LEED Gold for its projects.


