


Personal finance website WalletHub has recently determined which U.S. states have contributed most to America’s innovative success and which have been lacking.
The site analyzed the states (and the District of Columbia) across 18 key metrics such as share of STEM professionals, scientific knowledge output, eighth grade math and science performance, R&D spending per capita, tax friendliness, and average internet speed.
Below are some of the highlights from the analysis followed by the ten most and least innovative states:
- The District of Columbia has the highest share of STEM professionals, 9.4 percent, 2.8 times higher than in Mississippi and Nevada, which have the lowest at 3.3 percent each.
- Virginia has the highest share of technology companies, 7.52 percent, 3.9 times higher than in West Virginia, which has the lowest at 1.95 percent.
- New Mexico has the highest research and development (R&D) intensity, 6.31 percent, 19.7 times higher than in Wyoming, which has the lowest at 0.32 percent.
- The District of Columbia has the fastest average Internet speed, 22.47 Mbps, 2.1 times faster than in Idaho, which has the slowest at 10.65 Mbps.
- The District of Columbia has the highest share of public high-school students who completed advanced-placement (AP) exams, 60.2 percent, 4.4 times higher than in North Dakota, which has the lowest at 13.8 percent.
Most Innovative States
1. District of Columbia
2. Maryland
3. Massachusetts
4. California
5. Colorado
6. Washington
7. Virginia
8. Utah
9. Connecticut
10. New Hampshire
Least Innovative States
42. Maine
43. South Dakota
44. Iowa
45. Tennessee
46. North Dakota
47. Oklahoma
48. Kentucky
49. Louisiana
50. Mississippi
51. West Virginia
For the full list and an in-depth look at the methodology, click here.
Related Stories

Market Data | Sep 22, 2016
Architecture Billings Index slips, overall outlook remains positive
Business conditions are slumping in the Northeast.

Market Data | Sep 20, 2016
Backlog skyrockets for largest firms during second quarter, but falls to 8.5 months overall
While a handful of commercial construction segments continue to be associated with expanding volumes, for the most part, the average contractor is no longer getting busier, says ABC Chief Economist Anirban Basu.
Designers | Sep 13, 2016
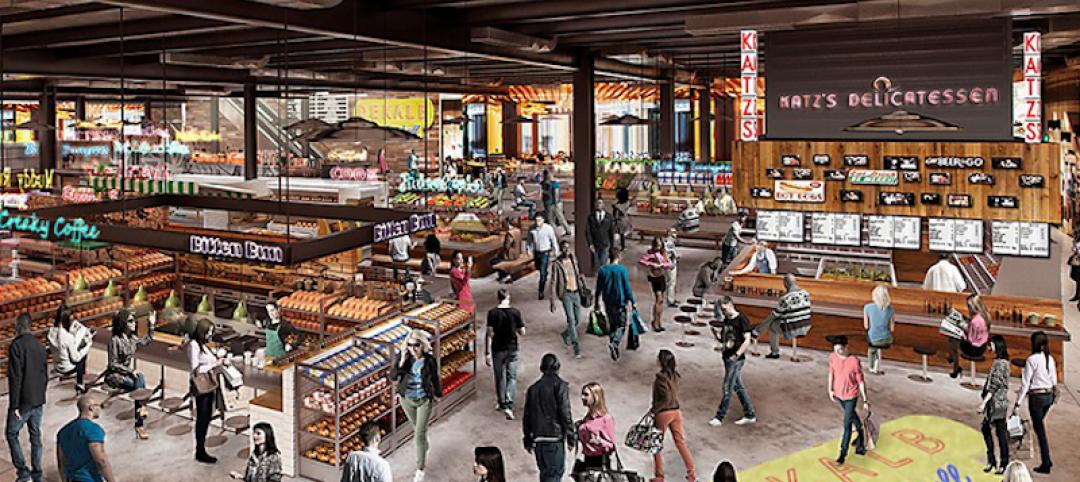
5 trends propelling a new era of food halls
Food halls have not only become an economical solution for restauranteurs and chefs experiencing skyrocketing retail prices and rents in large cities, but they also tap into our increased interest in gourmet locally sourced food, writes Gensler's Toshi Kasai.
Building Team | Sep 6, 2016
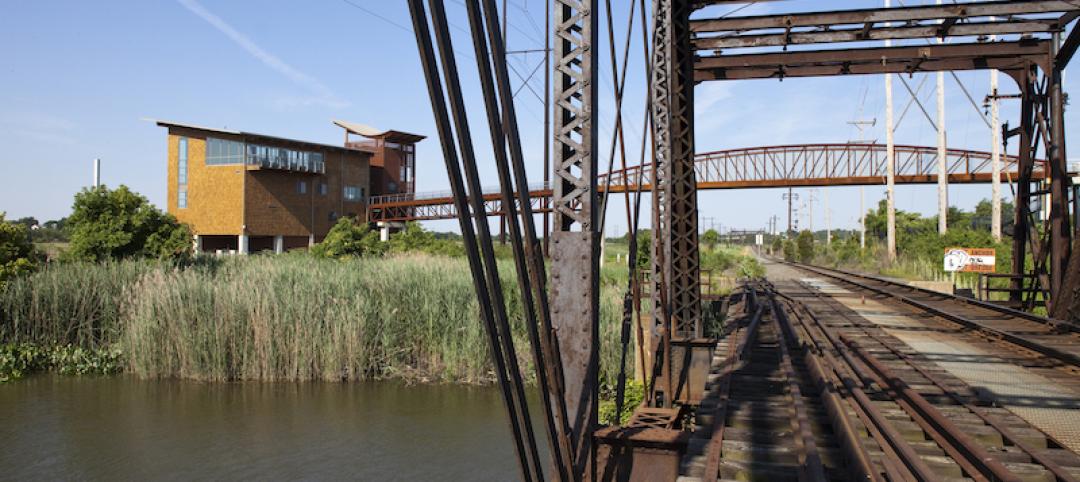
Letting your resource take center stage: A guide to thoughtful site selection for interpretive centers
Thoughtful site selection is never about one factor, but rather a confluence of several components that ultimately present trade-offs for the owner.

Market Data | Sep 2, 2016
Nonresidential spending inches lower in July while June data is upwardly revised to eight-year record
Nonresidential construction spending has been suppressed over the last year or so with the primary factor being the lack of momentum in public spending.

Industry Research | Sep 1, 2016
CannonDesign releases infographic to better help universities obtain more R&D funding
CannonDesign releases infographic to better help universities obtain more R&D funding.

Industry Research | Aug 25, 2016
Building bonds: The role of 'trusted advisor' is earned not acquired
A trusted advisor acts as a guiding partner over the full course of a professional relationship.

Multifamily Housing | Aug 17, 2016
A new research platform launches for a data-deprived multifamily sector
The list of leading developers, owners, and property managers that are funding the NMHC Research Foundation speaks to the information gap it hopes to fill.

Hotel Facilities | Aug 17, 2016
Hotel construction continues to flourish in major cities
But concerns about overbuilding persist.

Market Data | Aug 16, 2016
Leading economists predict construction industry growth through 2017
The Chief Economists for ABC, AIA, and NAHB all see the construction industry continuing to expand over the next year and a half.


