


Personal finance website WalletHub has recently determined which U.S. states have contributed most to America’s innovative success and which have been lacking.
The site analyzed the states (and the District of Columbia) across 18 key metrics such as share of STEM professionals, scientific knowledge output, eighth grade math and science performance, R&D spending per capita, tax friendliness, and average internet speed.
Below are some of the highlights from the analysis followed by the ten most and least innovative states:
- The District of Columbia has the highest share of STEM professionals, 9.4 percent, 2.8 times higher than in Mississippi and Nevada, which have the lowest at 3.3 percent each.
- Virginia has the highest share of technology companies, 7.52 percent, 3.9 times higher than in West Virginia, which has the lowest at 1.95 percent.
- New Mexico has the highest research and development (R&D) intensity, 6.31 percent, 19.7 times higher than in Wyoming, which has the lowest at 0.32 percent.
- The District of Columbia has the fastest average Internet speed, 22.47 Mbps, 2.1 times faster than in Idaho, which has the slowest at 10.65 Mbps.
- The District of Columbia has the highest share of public high-school students who completed advanced-placement (AP) exams, 60.2 percent, 4.4 times higher than in North Dakota, which has the lowest at 13.8 percent.
Most Innovative States
1. District of Columbia
2. Maryland
3. Massachusetts
4. California
5. Colorado
6. Washington
7. Virginia
8. Utah
9. Connecticut
10. New Hampshire
Least Innovative States
42. Maine
43. South Dakota
44. Iowa
45. Tennessee
46. North Dakota
47. Oklahoma
48. Kentucky
49. Louisiana
50. Mississippi
51. West Virginia
For the full list and an in-depth look at the methodology, click here.
Related Stories
Market Data | Apr 22, 2020
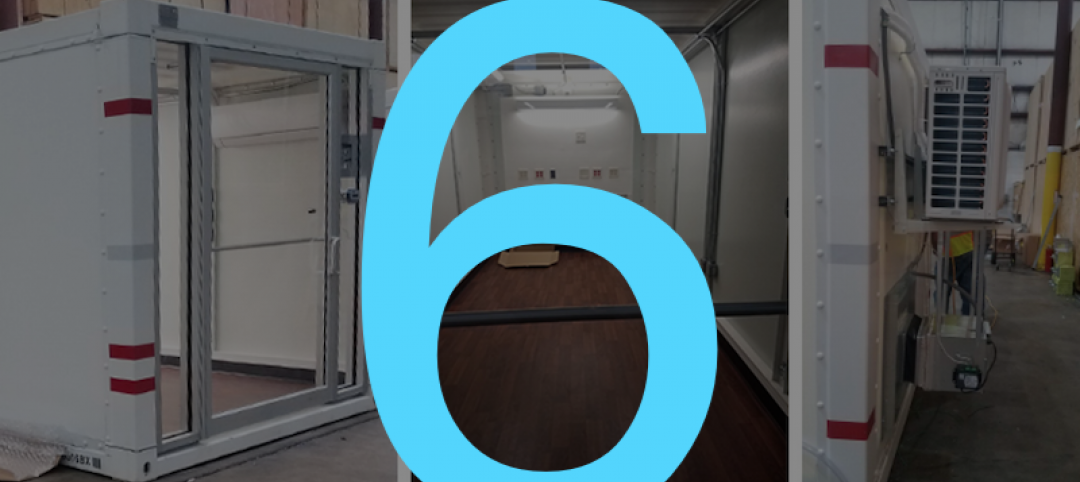
6 must reads for the AEC industry today: April 22, 2020
Repurposed containers can be used as rapid response airborne infection isolation rooms and virtual site visits help control infection on project sites.
Market Data | Apr 21, 2020
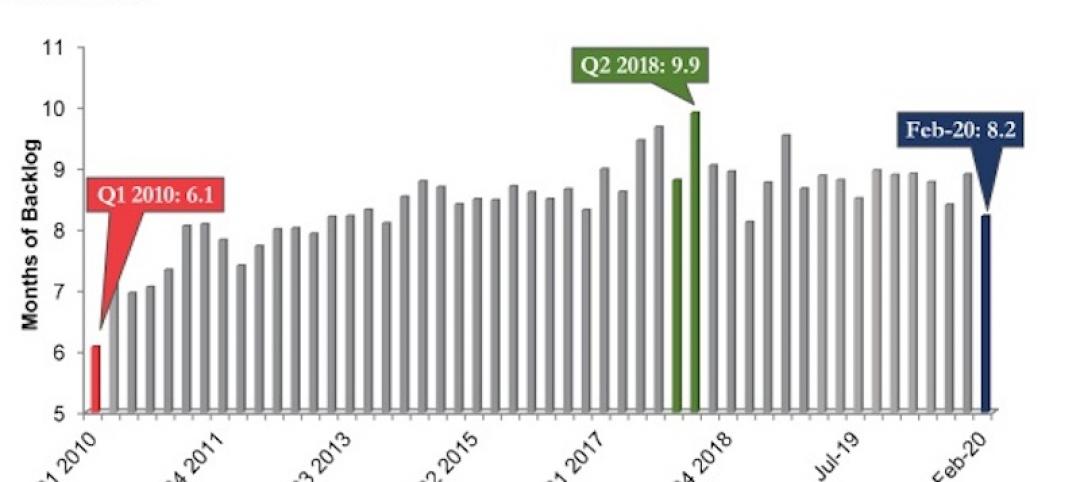
ABC's Construction Backlog Indicator down in February
Backlog for firms working in the infrastructure segment rose by 1.3 months in February while backlog for commercial and institutional and heavy industrial firms declined by 0.6 months and 0.7 months, respectively.

Market Data | Apr 21, 2020
5 must reads for the AEC industry today: April 21, 2020
IoT system helps contractors keep their distance and the multifamily market flattens.

Market Data | Apr 20, 2020
6 must reads for the AEC industry today: April 20, 2020
The continent's tallest living wall and NMHC survey shows significant delays in apartment construction.

Market Data | Apr 17, 2020
Construction employment declines in 20 states and D.C. in March, in line with industry survey showing growing job losses for the sector
New monthly job loss data foreshadows more layoffs amid project cancellations and state cutbacks in road projects as association calls for more small business relief and immediate aid for highway funding.

Market Data | Apr 17, 2020
5 must reads for the AEC industry today: April 17, 2020
Meet the 'AEC outsiders' pushing the industry forward and the world's largest Living Building.

Market Data | Apr 16, 2020
5 must reads for the AEC industry today: April 16, 2020
The SMPS Foundation and Building Design+Construction are studying the impact of the coronavirus pandemic on the ability to attain and retain clients and conduct projects and Saks Fifth Avenue plans a sanitized post-coronavirus opening.

Market Data | Apr 15, 2020
5 must reads for the AEC industry today: April 15, 2020
Buildings as "open source platforms" and 3D printing finds its grove producing face shields.

Market Data | Apr 14, 2020
6 must reads for the AEC industry today: April 14, 2020
A robot dog conducts site inspections and going to the library with little kids just got easier.

Market Data | Apr 13, 2020
6 must reads for the AEC industry today: April 13, 2020
How prefab can enable the AEC industry to quickly create new hospital beds and Abu Dhabi launches a design competition focused on reducing urban heat island effect.


